Solana (SOL) Rockets Over 10%: Analyzing The Bullish Trend
Solana started strong increase above the $135 resistance. SOL price is up over 10% on the ETF hopes and it might rise further toward $162. SOL price started a steady increase and cleared the $142 resistance against the U...

Solana started strong increase above the $135 resistance. SOL price is up over 10% on the ETF hopes and it might rise further toward $162.
- SOL price started a steady increase and cleared the $142 resistance against the US Dollar.
- The price is now trading above $142 and the 100-hourly simple moving average.
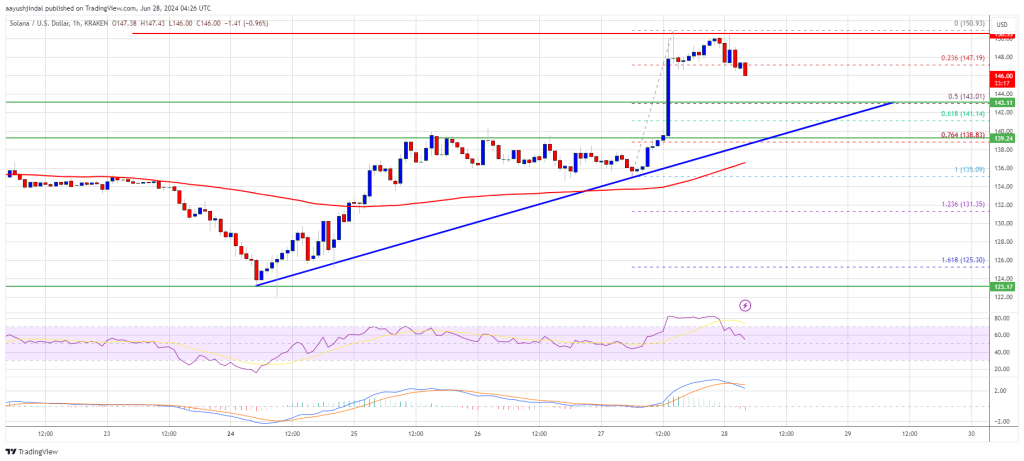
- There is a connecting bullish trend line forming with support at $142 on the hourly chart of the SOL/USD pair (data source from Kraken).
- The pair could correct lower and find bids near the $140-$142 zone.
Solana price formed a base above the $125 level and started a fresh increase. SOL broke many hurdles near the $135 and $140 levels to move into a positive zone. It gained over 10%, cleared the $145 resistance, and outperformed Bitcoin and Ethereum.
A high was formed at $150.93 and the price is now consolidating gains. It is trading near the 23.6% Fib retracement level of the upward move from the $135 swing low to the $151 high.
Solana is now trading well above the $142 level and the 100-hourly simple moving average. There is also a connecting bullish trend line forming with support at $142 on the hourly chart of the SOL/USD pair. The trend line is close to the 50% Fib retracement level of the upward move from the $135 swing low to the $151 high.
If there is another increase, the price might face resistance near the $150 level. The next major resistance is near the $152 level. A successful close above the $152 resistance could set the pace for another steady increase. The next key resistance is near $162. Any more gains might send the price toward the $175 level.
Are Dips Supported in SOL?If SOL fails to rise above the $152 resistance, it could start another decline. Initial support on the downside is near the $145 level.
The first major support is near the $142 level and the trend line, below which the price could test $140. If there is a close below the $140 support, the price could decline toward the $128 support in the near term.
Technical Indicators
Hourly MACD – The MACD for SOL/USD is gaining pace in the bullish zone.
Hourly Hours RSI (Relative Strength Index) – The RSI for SOL/USD is above the 50 level.
Major Support Levels – $145, and $142.
Major Resistance Levels – $152 and $162.
Original source
Read on NewsBTCRelated market context

Standard Chartered Says Bitcoin Bottomed Near $59,000 As Crypto Winter Ends
TL;DR Standard Chartered’s Geoffrey Kendrick reportedly says Bitcoin’s $59,000 area marked the cycle bottom. The note cites SpaceX...

Elon Musk SpaceX AI Predicts Incredible Bitcoin Price For Next 30 Days
Here is the thing about capitulation calls. They only sound smart in hindsight. Right now, with Bitcoin price scraping along the l...

Bitcoin Mining Cost Model Points To $47,000 Floor, But Analysts Urge Caution
TL;DR Crypto Rover says Bitcoin has never bottomed below electrical production cost, currently estimated at $47,000. Mining-cost m...

Bitcoin rises above $64,000 after Pakistan prime minister says Iran peace deal is near
Bitcoin traded above $64,000 on Saturday, supported by its strongest ETF inflows in a month and growing optimism around geopolitic...

Bitcoin price faces new risk as big buyers lose conviction
Bitcoin’s largest buyers are no longer behaving like a reliable backstop for the largest cryptocurrency. The exchange-traded funds...

XRP aims for $0.90 as ETF demand battles selling pressure from whales
XRP is trading at $1.11, down roughly 17% from its June opening, having set a new 2026 low on June 5 and shed $8 billion in market...