Solana (SOL) Slips Further As Bears Target Deeper Support Zones
Solana failed to settle above $132 and extended losses. SOL price is now consolidating losses below $130 and might struggle to start a recovery wave. SOL price started a fresh decline below $132 and $130 against the US D...
Archive context
Older archive item. Useful for background and entity history, but not a fresh market-moving signal.

Solana failed to settle above $132 and extended losses. SOL price is now consolidating losses below $130 and might struggle to start a recovery wave.
- SOL price started a fresh decline below $132 and $130 against the US Dollar.
- The price is now trading below $130 and the 100-hourly simple moving average.
- There is a key bearish trend line forming with resistance at $126 on the hourly chart of the SOL/USD pair (data source from Kraken).
- The price could start a recovery wave if the bulls defend $118 or $115.
Solana price failed to remain stable above $132 and started a fresh decline, like Bitcoin and Ethereum. SOL declined below the $130 and $126 support levels.
The price gained bearish momentum below $122. A low was formed at $117, and the price is now consolidating losses. The price recovered a few points and climbed above the 23.6% Fib retracement level of the downward move from the $132 swing high to the $117 low.
Solana is now trading below $130 and the 100-hourly simple moving average. On the upside, immediate resistance is near the $125 level or the 50% Fib retracement level of the downward move from the $132 swing high to the $117 low.
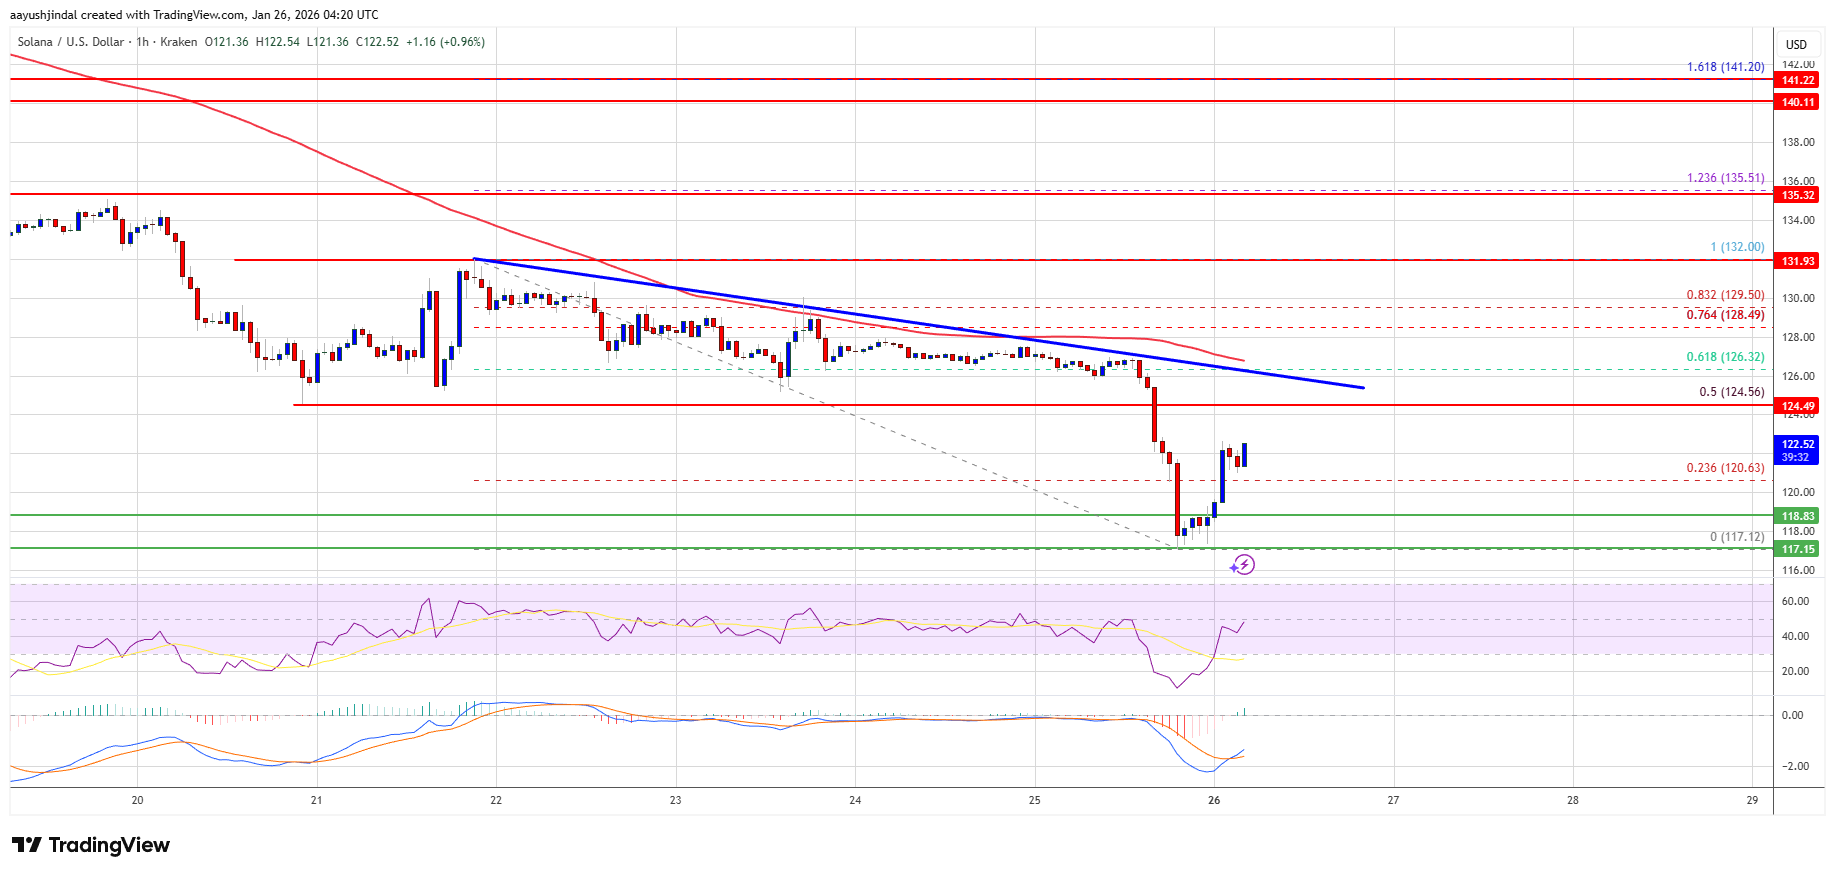
The next major resistance is near the $126 level. There is also a key bearish trend line forming with resistance at $126 on the hourly chart of the SOL/USD pair. The main resistance could be $132. A successful close above the $132 resistance zone could set the pace for another steady increase. The next key resistance is $140. Any more gains might send the price toward the $144 level.
Another Drop In SOL?If SOL fails to rise above the $126 resistance, it could continue to move down. Initial support on the downside is near the $119 zone. The first major support is near the $117 level.
A break below the $117 level might send the price toward the $115 support zone. If there is a close below the $115 support, the price could decline toward the $102 support in the near term.
Technical Indicators
Hourly MACD – The MACD for SOL/USD is losing pace in the bearish zone.
Hourly Hours RSI (Relative Strength Index) – The RSI for SOL/USD is below the 50 level.
Major Support Levels – $117 and $115.
Major Resistance Levels – $126 and $132.
Why this matters
Solana is a tracked market entity in the DigitalMoneyBox archive, making this useful context for readers monitoring repeated mentions and follow-up coverage.
Original source
Read on NewsBTCRelated market context

Worldcoin (WLD) Price Prediction: Can Grayscale’s Worldcoin ETF Filing Trigger a WLD Rebound Above $0.45?
The filing has put the token back in focus at a time when WLD remains well below its recent 2026 highs and technical indicators co...

Ethereum Price Eyes $2,000 as AI Funds Shift From Chips to ETH, Says Tom Lee
Ethereum is pressing against a price level that has capped every rally. ETH trades at $1,925, little changed over the past 24 hour...

XRP Price Prediction: XRP Holds Above $1.14 as Bulls Battle to Reverse the Broader Downtrend
The move has improved the short-term technical picture, but the broader trend remains under pressure as XRP continues to trade bel...
Bitcoin Price Prediction: Bitcoin Volatility Hits 2016 Low, Could Trigger Liquidations
Bitcoin price is trading around $66,100, after climbing above $66,500 earlier in the session, in a bullish prediction environment....

XRP Price Could Turn Volatile This Month: What’s at Stake for Ripple?
XRP price is trading around $1.13, up about 2% over the past 24 hours. Those modest gains hide a much larger binary risk approachi...

Trump Says Yes to Crypto Ethics Rule, Puts DOJ as Enforcer
Bitcoin is trading around $66,000 with muted directional conviction, while Washington has added another variable to the equation....