Solana (SOL) Trades Heavy Below $90 As Breakdown Risk Grows
Solana failed to stay above $90 and corrected gains. SOL price is now trading below $85 and might find bids near the $76 zone. SOL price started a downside correction below $85 against the US Dollar. The price is now tra...
Archive context
Older archive item. Useful for background and entity history, but not a fresh market-moving signal.

Solana failed to stay above $90 and corrected gains. SOL price is now trading below $85 and might find bids near the $76 zone.
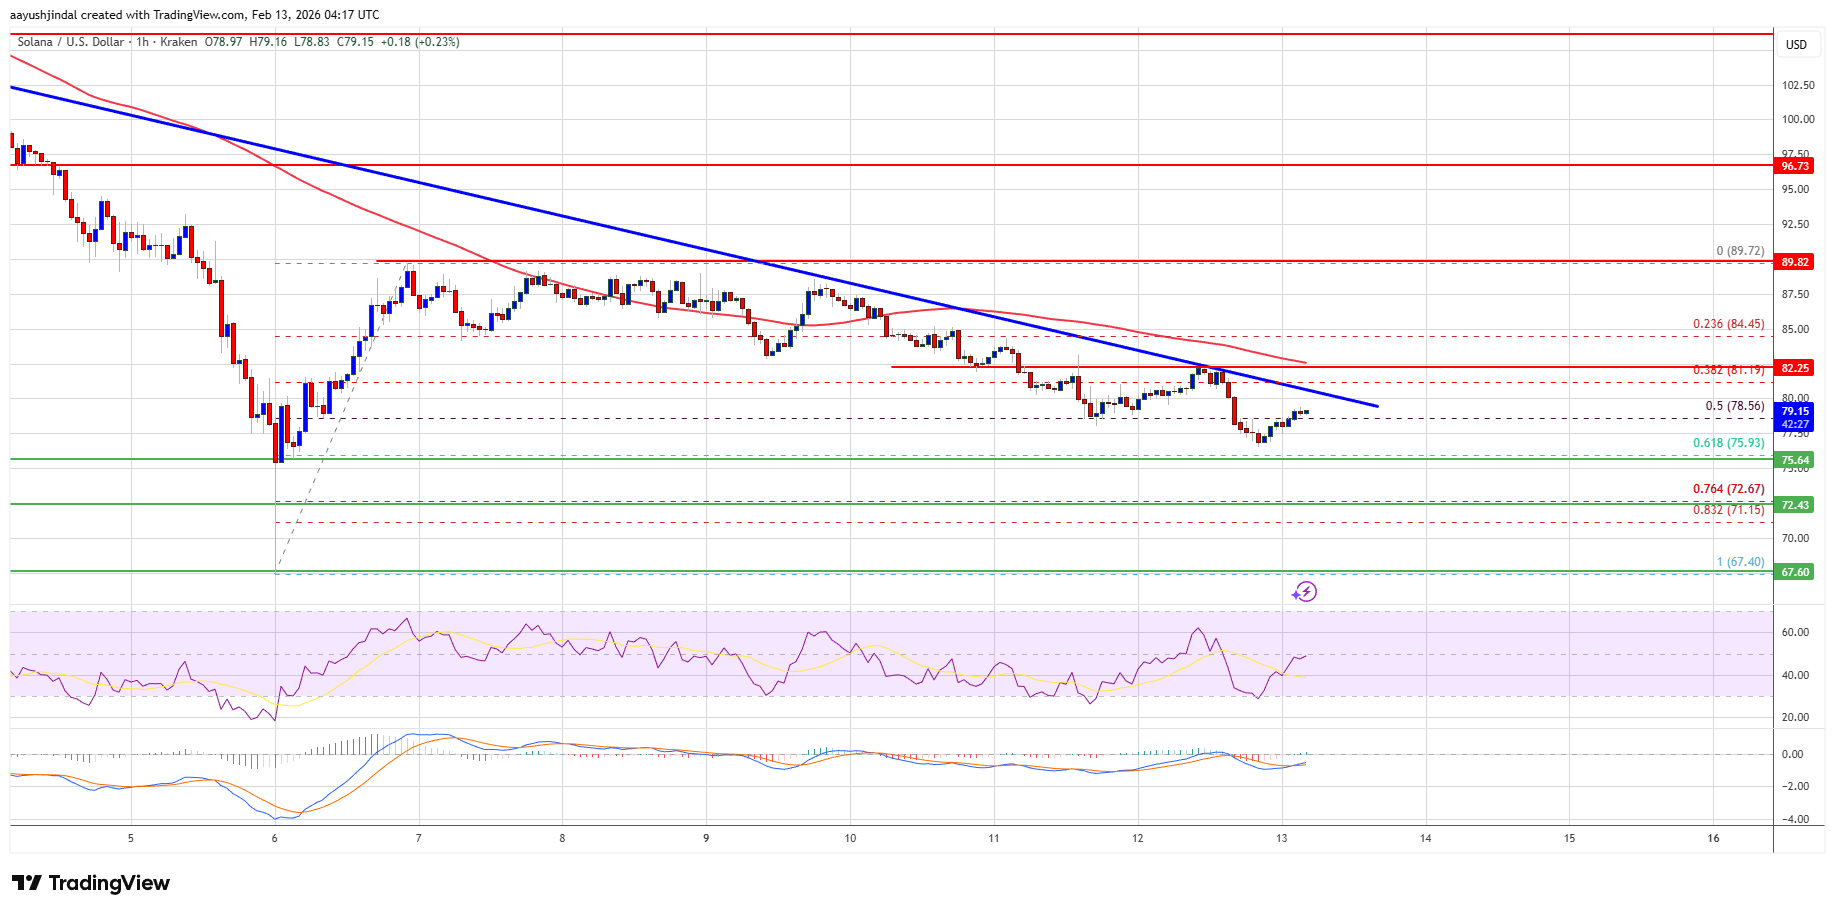
- SOL price started a downside correction below $85 against the US Dollar.
- The price is now trading below $82 and the 100-hourly simple moving average.
- There is a bearish trend line forming with resistance at $81 on the hourly chart of the SOL/USD pair (data source from Kraken).
- The pair could extend losses if it dips below the $76 zone.
Solana price failed to surpass $90 and started a downside correction, like Bitcoin and Ethereum. SOL dipped below $85 and $82 to enter a short-term bearish zone.
There was a move below the 50% Fib retracement level of the upward wave from the $67.40 swing low to the $89.72 high. Besides, there is a bearish trend line forming with resistance at $81 on the hourly chart of the SOL/USD pair.
Solana is now trading below $80 and the 100-hourly simple moving average. On the upside, the price is facing resistance near the $81 level and the trend line. The next major resistance is near the $82.20 level. The main resistance could be $85. A successful close above the $85 resistance zone could set the pace for another steady increase. The next key resistance is $90. Any more gains might send the price toward the $102 level.
More Losses In SOL?If SOL fails to rise above the $82 resistance, it could start another decline. Initial support on the downside is near the $76 zone and the 61.8% Fib retracement level of the upward wave from the $67.40 swing low to the $89.72 high. The first major support is near the $72.50 level.
A break below the $72.50 level might send the price toward the $68 support zone. If there is a close below the $68 support, the price could decline toward the $60 support in the near term.
Technical Indicators
Hourly MACD – The MACD for SOL/USD is gaining pace in the bearish zone.
Hourly Hours RSI (Relative Strength Index) – The RSI for SOL/USD is below the 50 level.
Major Support Levels – $76 and $72.50.
Major Resistance Levels – $81 and $85.
Why this matters
Solana is a tracked market entity in the DigitalMoneyBox archive, making this useful context for readers monitoring repeated mentions and follow-up coverage.
Original source
Read on NewsBTCRelated market context

Ethereum Price Eyes $2,000 as AI Funds Shift From Chips to ETH, Says Tom Lee
Ethereum is pressing against a price level that has capped every rally. ETH trades at $1,925, little changed over the past 24 hour...

Ethereum Security Team Turns To AI Agents For Vulnerability Triage
The Ethereum Foundation’s Protocol Security team is using coordinated AI agents to help scan protocol repositories and devnets for...

Ethereum ETF Inflows Extend To Third Day As BlackRock Offsets Fidelity Outflows
US spot Ethereum ETFs have recorded a third consecutive day of net inflows, giving ETH traders another sign that institutional dem...

Ethereum News: Builder Activity & Leverage Data Align, $2k Next?
In Ethereum news today, new smart contract deployments on the network have surged 192% above the 90-day baseline, with funding rat...

XRP Price Could Turn Volatile This Month: What’s at Stake for Ripple?
XRP price is trading around $1.13, up about 2% over the past 24 hours. Those modest gains hide a much larger binary risk approachi...

Sky Protocol Revenue Nears $419M Annualized As USDS Demand Supports DeFi Income
Sky Protocol’s annualized gross revenue has climbed close to $419 million, according to its governance status dashboard, giving De...