TD Sequential Flashes Buy: Dogecoin Ready For Rebound To $0.21
Dogecoin has spent the majority of the past five days trading within a tight range between $0.156 and $0.165. Notably, the meme coin is now showing early signs of stabilization after its steep correction earlier this mon...
Archive context
Older archive item. Useful for background and entity history, but not a fresh market-moving signal.

Dogecoin has spent the majority of the past five days trading within a tight range between $0.156 and $0.165. Notably, the meme coin is now showing early signs of stabilization after its steep correction earlier this month, with bulls beginning to reclaim ground after a drop below the $0.17 price barrier.
Reclaiming the $0.17 level is important, according to technical analysis of Dogecoin’s price. This technical backdrop sets the stage for a projected price move to $0.21.
TD Sequential Flashes Buy Signal For DogecoinDogecoin’s 3-day candlestick timeframe chart shows that the meme coin is currently trading just above an ascending trendline that dates back to late 2023, which has acted as a key support level across multiple correction cycles. Despite the recent volatility, the price structure appears to be ready for a possible bounce move from here due to the formation of less volatile candlesticks and higher lows just above the 0.5 Fibonacci retracement level around $0.165.
Taking to the social media platform X, crypto analyst Ali Martinez revealed an interesting bullish signal taking place on the same 3-day candlestick timeframe. According to Martinez, Dogecoin has just triggered a buy signal on the 3-day TD Sequential indicator. This tool, which identifies trend exhaustion and possible reversals, has been quite useful in predicting buy and sell zones this cycle.
However, the bullish outlook depends on Dogecoin reclaiming the $0.17 price level, which is now working as some sort of resistance. Martinez noted that a breakout above this price level could allow Dogecoin to rebound to $0.21. Notably, this $0.21 price target coincides with the 0.618 Fibonacci extension from Dogecoin’s October 2023 low.
Path To $0.21 Needs Enough VolumeFor Dogecoin to confirm a return to $0.21, market participation must return in a meaningful way. This is because Dogecoin’s trading volume has been notably low over the past few days. According to data from CoinMarketCap, Dogecoin’s 24-hour trading volume is currently at just $400 million, which is a 36.7% decrease from the previous day. This level of activity is significantly below Dogecoin’s usual trading volume during periods of upward momentum.
Such a slowdown in volume suggests that, despite the bullish technical signal from the TD Sequential indicator, the necessary follow-through from buyers is yet to be confirmed.
At the time of writing, Dogecoin is trading at $0.1637, up by 1.7% in the past 24 hours. Until volume picks up, Dogecoin may continue to consolidate or even drift sideways, regardless of the bullish indicators. Unless there’s strong interest and stronger inflows, the breakout setup could fizzle out or result in another rejection at $0.17.
Featured image from Unsplash, chart from TradingView
Why this matters
This altcoin story adds another data point to the current market tape and is useful when read alongside nearby source coverage.
Original source
Read on NewsBTCRelated market context

It just got 25 times easier to move self-custody Bitcoin directly onto Wall Street, and $5 billion already has
BlackRock cut the minimum for converting privately held Bitcoin into IBIT shares from $25 million to $1 million, while Bitwise low...

Investors just moved $7 billion into Bitcoin and gold in five days to escape an accelerating dollar crisis
Gold and Bitcoin exchange-traded funds (ETFs) drew roughly $7 billion over five US trading sessions, a record combined haul that p...

Morgan Stanley leads Solana ETF $9 million inflows as SOL jumps rises above $100
US Solana exchange-traded funds (ETFs) attracted about $9.1 million in net inflows on Aug. 26, led by Morgan Stanley’s MSOL. SoSoV...

Bitcoin (BTC) Price Prediction: Hidden Weekly RSI Divergence Warns of Pullback as BTC Tests $80K
Bitcoin price was trading around $80,500 on Bitstamp in the latest technical reading, up 3.11% on the session. While the price rem...
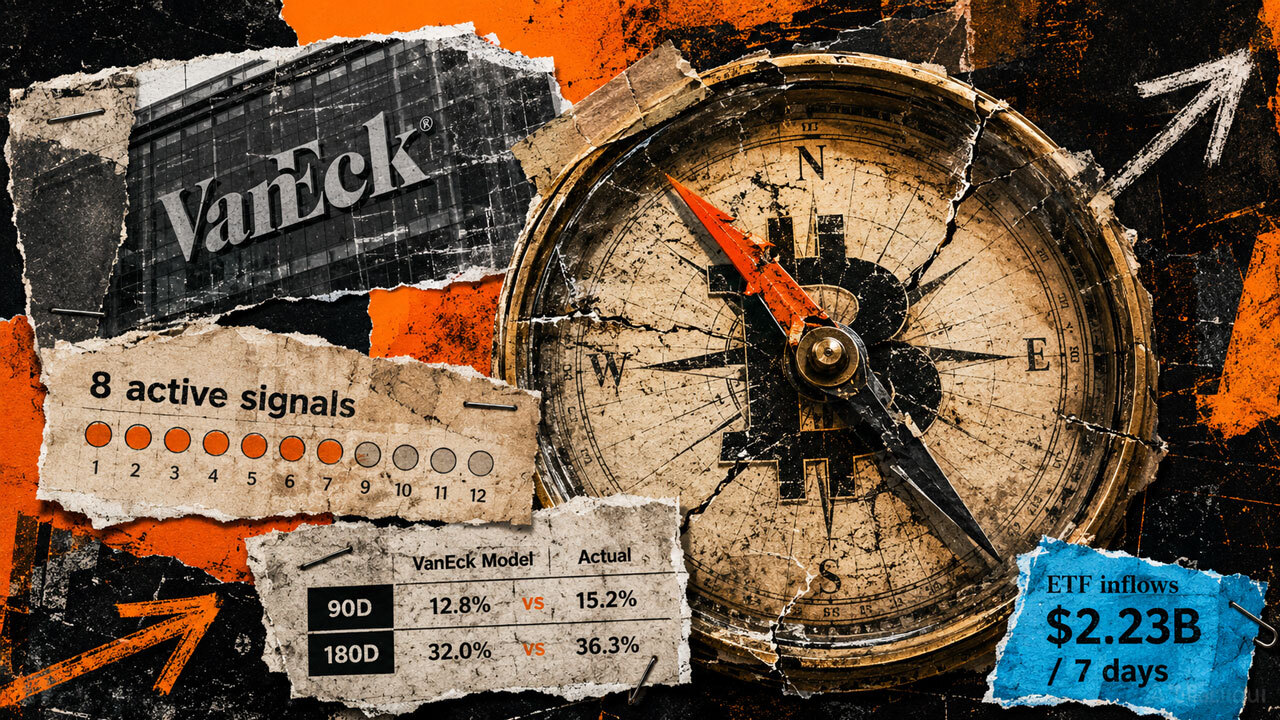
Bitcoin’s bottom signal is flashing, but six months of data shows a trap waiting for early buyers
Bitcoin’s late-August recovery has unfolded in stages. Days prior to the Aug. 19 pump, VanEck’s capitulation dashboard showed broa...

Ethereum (ETH) Price Prediction: ETH Holds $2,400 Breakout as Bulls Target $2,600 and $2,823
Ethereum price has quietly worked its way back into an important part of the chart after a strong recovery from recent lows. The p...