The Worst Case For XRP This Cycle? Just A Giga Rally To $19, Says Analyst
XRP’s weekly structure has seldom looked as compressed as it does in the chart published this morning by independent analyst Maelius. The view pulls data from the BITSTAMP feed and applies a 50-period exponential moving...
Archive context
Older archive item. Useful for background and entity history, but not a fresh market-moving signal.

XRP’s weekly structure has seldom looked as compressed as it does in the chart published this morning by independent analyst Maelius. The view pulls data from the BITSTAMP feed and applies a 50-period exponential moving average (EMA) in blue, currently tracking at roughly $1.78.
This XRP Chart Screams 2017Price is perched above that dynamic support zone at $2.25, adding 3.33% so far in the present weekly candle, and has spent the past four months knitting out what the analyst calls a “giga bull flag.” The flag is defined by a sequence of progressively lower weekly highs that stop just short of the $3.40 line and higher swing-lows that bottom near $1.61, creating a converging wedge whose lower edge and the rising EMA50 now coincide.
Maelius overlays the 2017 XRP advance—scaled to the current log axis—to illustrate why the pattern matters. In the previous cycle the token erupted vertically once the flag was resolved, blasting from sub-dollar prices to a peak above $3.00 in a matter of weeks.
The black schematic sketched on the right-hand margin recreates that move and projects it forward: once consolidation ends, the fractal implies a breakout first through the $4 shelf and ultimately into the double-digit territory. The label “XRP 2017” is pinned to the $19 mark, the level where the composite trace tops out on this overlay.
Momentum data beneath the chart reinforce the comparison. The weekly Relative Strength Index (RSI) printed two pronounced peaks in the 2017 run, separated by a flat plateau; Maelius has marked those crests “1” and “2” on both the historical section and the current range.
The first modern-cycle surge sent RSI briefly into the high-80s earlier this year and has since cooled back toward the mid-40s, a zone the analyst shades “FLAT.” An arrow then extends toward the mid-90s, signalling that Maelius expects at least one more momentum pulse before the structure is exhausted.
From a purely technical perspective the most immediate levels to watch are the upper flag boundary near $2.50 and the EMA-anchored support around $1.80. A weekly close above the former would complete the flag and open the way to the $4.40 and $6.00 horizontals visible on the price scale, while a decisive break below $1.80 would invalidate the pattern and leave the market leaning on the $1.30 cluster where the EMA turned higher last year.
Crucially, the analyst frames his outlook in risk-aware terms: even the “worst-case” scenario he sketches still includes one final impulse wave. “Worst case is there is only 1 impulse left. Bearish, right?!” he writes.
As always, traders will be looking for confirmation from volume and broader market sentiment before treating the fractal as more than an instructive historical rhyme, but the chart makes clear that a single weekly candle settling above the $2.50 handle could be all it takes to remind participants of how quickly XRP has moved in the past.
At press time, XRP traded at $2.23.
Why this matters
This altcoin story adds another data point to the current market tape and is useful when read alongside nearby source coverage.
Original source
Read on NewsBTCRelated market context

Bitcoin (BTC) Price Prediction: Hidden Weekly RSI Divergence Warns of Pullback as BTC Tests $80K
Bitcoin price was trading around $80,500 on Bitstamp in the latest technical reading, up 3.11% on the session. While the price rem...
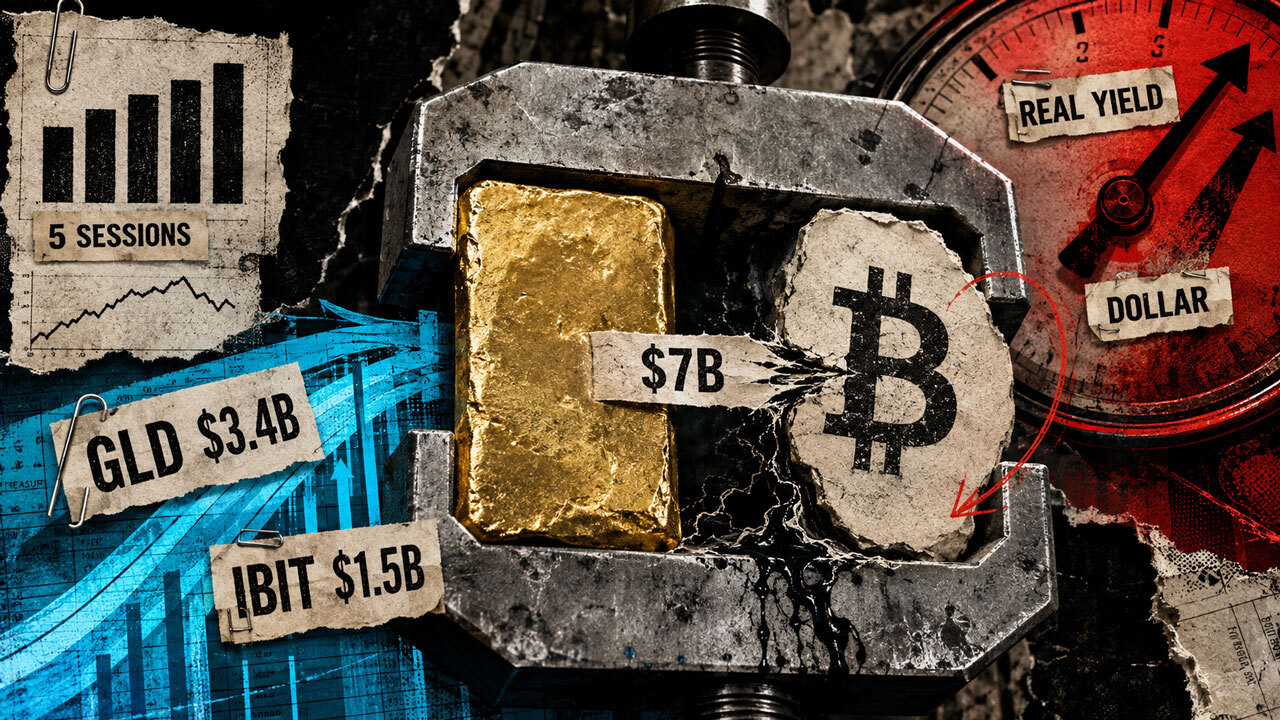
Investors just moved $7 billion into Bitcoin and gold in five days to escape an accelerating dollar crisis
Gold and Bitcoin exchange-traded funds (ETFs) drew roughly $7 billion over five US trading sessions, a record combined haul that p...

Morgan Stanley leads Solana ETF $9 million inflows as SOL jumps rises above $100
US Solana exchange-traded funds (ETFs) attracted about $9.1 million in net inflows on Aug. 26, led by Morgan Stanley’s MSOL. SoSoV...

Bitcoin News: Debt Hedge Case Meets Senate Roadblocks for CLARITY Act
U.S. fiscal concerns and digital-asset legislation news have emerged as separate forces in the Bitcoin market. Senator Cynthia Lum...

Ethereum (ETH) Price Prediction: ETH Holds $2,400 Breakout as Bulls Target $2,600 and $2,823
Ethereum price has quietly worked its way back into an important part of the chart after a strong recovery from recent lows. The p...

Bitcoin Price Prediction: Can BTC Reclaim $80K This Week?
Bitcoin price prediction has the leading digital asset trading at $79,400, down -0.4% on the day, as the market digests a violent...