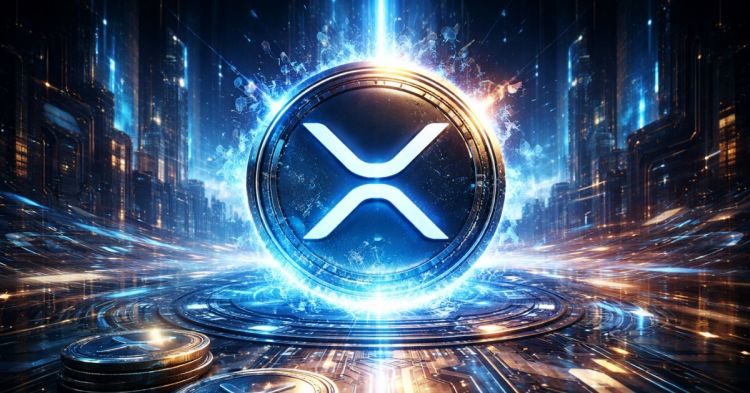
XRP Mirrors Gold’s Trajectory: What A Similar ATH Rally Would Mean
After enduring weeks of capitulation, sustained price declines, and overall market weakness last year, XRP is showing signs of a recovery. The cryptocurrency has rebounded above the $2.2 level after beginning the new yea...
Archive context
Older archive item. Useful for background and entity history, but not a fresh market-moving signal.
After enduring weeks of capitulation, sustained price declines, and overall market weakness last year, XRP is showing signs of a recovery. The cryptocurrency has rebounded above the $2.2 level after beginning the new year at a low of above $1.90. According to a crypto expert, XRP’s long-term outlook remains significantly bullish. He compares XRP’s projected trajectory to gold’s price movement, predicting a similar historic all-time high rally.
XRP Tracks Gold’s Historic RunMarket analyst ‘Steph is Crypto’ has stated that XRP is showing a rare chart setup that closely mirrors gold’s macro move between 2023 and 2025. In his analysis shared on X, the crypto expert explained that after a prolonged corrective phase, XRP has completed a clean Wave 4 structure, formed a Falling Wedge, and is now breaking out in a way that reflects early trend expansion behavior.
The analyst shared a parallel chart that illustrated gold’s price action over the years on one side and XRP’s movement and future trajectory on the other. Over the two-day timeframe, XRP has completed an impulsive Wave 1-3, followed by a downward-sloping corrective channel that slopes into Wave 4, ending with a compression typical of a Falling Wedge.
Steph is Crypto directly compares this formation and price movement to gold, which went through an almost identical structure earlier between 2022 and 2023. Following this corrective pattern, gold broke out decisively, entering a strong expansion phase that carried the price to new ATHs over the past months. The breakout also led to a sustained rally with minimal pullbacks and consolidation for almost two years.
Based on gold’s explosive historic performance, Steph is Crypto has projected that XRP could replicate a similar trajectory in 2026. The XRP chart shows price stabilizing above the Falling Wedge breakout area near the mid-$2 range. From there, the projected path suggests a rapid expansion phase that mirrors gold’s post-breakout trajectory.
If XRP replicates this historic run, it implies a new all-time high cycle, with the price potentially skyrocketing toward $37 before the end of 2026 or the beginning of 2027. The visual projection line on the chart shows that XRP could also experience a similar steady price expansion phase with minimal pullbacks along the way.
Analyst Says XRP Could Outperform Bitcoin SoonCrypto analyst Matt Hughes has shared a new analysis of the XRP/BTC chart, pointing to a potential shift in long-term price performance. He believes that XRP is gearing up to outperform Bitcoin this year, based on a rate technical signal that just emerged on the trading pair’s chart.
According to Hughes, an incredibly bullish setup that has not appeared in years is developing on the XRP/BTC chart. He stated that price is about to break above the monthly Ichimoku Cloud for the first time since 2018, when XRP exploded to its current ATH of $3.84. Notably, a successful move above this cloud would signal a deep structural change in the cryptocurrency’s trend, potentially leading to significant relative gains this year.
Why this matters
XRP is a tracked market entity in the DigitalMoneyBox archive, making this useful context for readers monitoring repeated mentions and follow-up coverage.
Original source
Read on NewsBTCRelated market context

Worldcoin (WLD) Price Prediction: Can Grayscale’s Worldcoin ETF Filing Trigger a WLD Rebound Above $0.45?
The filing has put the token back in focus at a time when WLD remains well below its recent 2026 highs and technical indicators co...

Bitcoin holds near $66,300 as semiconductor rally extends and yen plumbs 40-year low
Bitcoin consolidates near $66,300 as semiconductor stocks extend gains and the Japanese yen slides past 163 per dollar for the fir...

Bitcoin breaks $66,000 but 4 key signals show this rally is far from normal
Bitcoin surged past $66,000 for the first time since early June, extending a recovery that is beginning to repair some of the loss...

XRP Price Prediction: XRP Holds Above $1.14 as Bulls Battle to Reverse the Broader Downtrend
The move has improved the short-term technical picture, but the broader trend remains under pressure as XRP continues to trade bel...

Bitcoin rally faces key test at $68,000 as 'summer slumber' grips crypto, analysts say
BTC has rebounded 15% from the July lows, but some analysts cautioned that the next move hinges on clearing a level where many rec...

Ethereum News: Builder Activity & Leverage Data Align, $2k Next?
In Ethereum news today, new smart contract deployments on the network have surged 192% above the 90-day baseline, with funding rat...