XRP Price at Risk of Correction – Bulls Losing Steam?
XRP price started a decent increase above $3.00 zone. The price is now facing resistance at $3.10 and might correct some gains in the near term. XRP price is attempting to start a fresh increase above the $3.00 zone. The...
Archive context
Older archive item. Useful for background and entity history, but not a fresh market-moving signal.

XRP price started a decent increase above $3.00 zone. The price is now facing resistance at $3.10 and might correct some gains in the near term.
- XRP price is attempting to start a fresh increase above the $3.00 zone.
- The price is now trading above $2.980 and the 100-hourly Simple Moving Average.
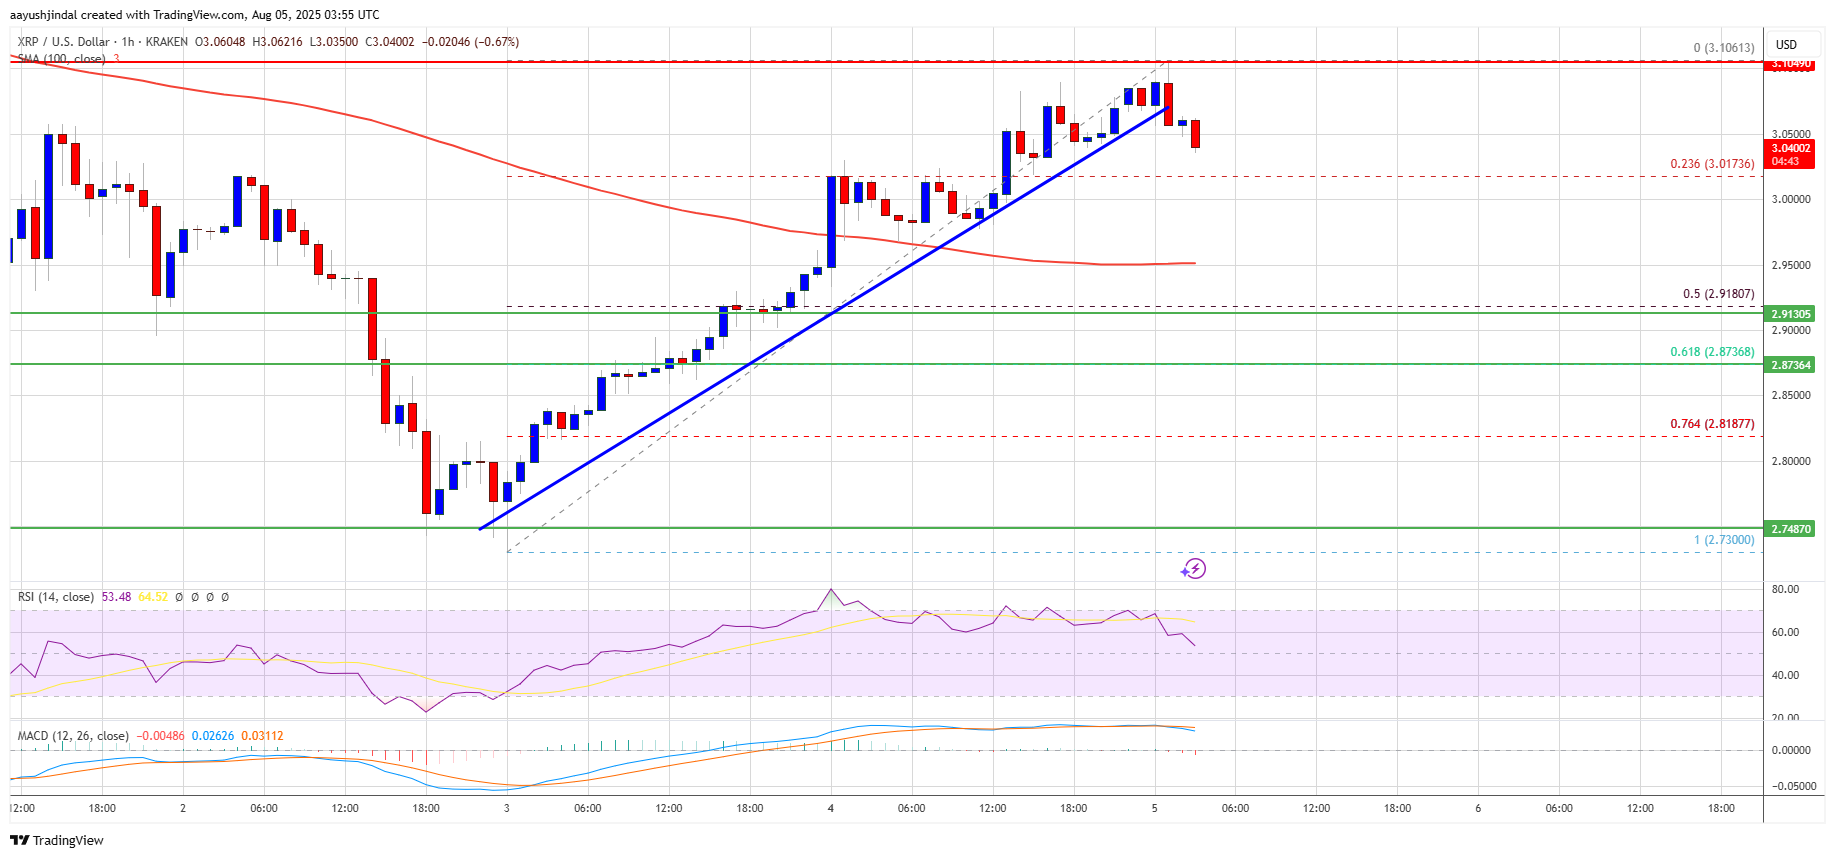
- There was a break below a bullish trend line with support at $3.065 on the hourly chart of the XRP/USD pair (data source from Kraken).
- The pair could start another increase if it stays above the $2.920 zone.
XRP price started a fresh increase above the $2.820 zone, beating Bitcoin and Ethereum. The price was able to surpass the $2.920 and $2.950 resistance levels.
The price even cleared the $3.00 resistance level. Finally, the bears appeared near the $3.10 zone. A high was formed at $3.106 and the price is now correcting gains. There was a break below a bullish trend line with support at $3.065 on the hourly chart of the XRP/USD pair.
The price is now trading above $3.00 and the 100-hourly Simple Moving Average. It is also above the 23.6% Fib retracement level of the upward move from the $2.730 swing low to the $3.106 high.
On the upside, the price might face resistance near the $3.10 level. The first major resistance is near the $3.120 level. A clear move above the $3.120 resistance might send the price toward the $3.150 resistance. Any more gains might send the price toward the $3.20 resistance or even $3.2120 in the near term. The next major hurdle for the bulls might be near the $3.250 zone.
Another Drop?If XRP fails to clear the $3.10 resistance zone, it could start another decline. Initial support on the downside is near the $3.00 level. The next major support is near the $2.950 level.
If there is a downside break and a close below the $2.950 level, the price might continue to decline toward the $2.920 support and the 50% Fib retracement level of the upward move from the $2.730 swing low to the $3.106 high. The next major support sits near the $2.880 zone where the bulls might take a stand.
Technical Indicators
Hourly MACD – The MACD for XRP/USD is now losing pace in the bullish zone.
Hourly RSI (Relative Strength Index) – The RSI for XRP/USD is now above the 50 level.
Major Support Levels – $3.00 and $2.920.
Major Resistance Levels – $3.10 and $3.120.
Why this matters
This altcoin story adds another data point to the current market tape and is useful when read alongside nearby source coverage.
Original source
Read on NewsBTCRelated market context

XRP Price Prediction: XRP Faces Critical Resistance Near $1.17 Despite Ripple Securing Landmark EU License
While the company secured a full MiCA license that expands its operations across the European Economic Area, market indicators sug...

Bitcoin price rebounds to $63K as leverage returns creating short term volatility risk
Bitcoin's rebound has cleared the first test: price recovered. The harder one starts now: proving buyers remain after the squeeze....

Elon Musk Grok AI Predicts Incredible XRP Price Target by End of 2026
Elon Musk Grok AI just published what might be the most partnership-heavy XRP price prediction in this entire series. The model pr...

Kraken Seeks Final Judgment After $22 Million Award Against Former Auditor
Bitcoin Magazine Kraken Seeks Final Judgment After $22 Million Award Against Former Auditor Payward, the parent company of the cry...
CleanSpark increases Bitcoin holdings by 454 BTC to 13,924 BTC
CleanSpark's self-funded growth and substantial BTC holdings position it well for future gains, but also risk balance sheet strain...
VanEck faces off against Fidelity in Bitcoin ETF showdown, but the scoreboard tells a lopsided story
The Bitcoin ETF market is consolidating, favoring major players like Fidelity, which could limit competition and innovation in the...