XRP Price Breaks Out Of Symmetrical Triangle Pattern, Why The Target Is $8
A new bullish target for the XRP price has been set, as a crypto analyst has announced a recent breakout from a Symmetrical Triangle pattern. The analyst has shared a chart showing XRP’s price action on a 3-day timeframe...
Archive context
Older archive item. Useful for background and entity history, but not a fresh market-moving signal.

A new bullish target for the XRP price has been set, as a crypto analyst has announced a recent breakout from a Symmetrical Triangle pattern. The analyst has shared a chart showing XRP’s price action on a 3-day timeframe, highlighting key resistance levels that could help propel the cryptocurrency to a bullish target of $8.
Symmetrical Triangle To Push XRP Price To $8According to the TradingView crypto analyst identified by the pseudonym “PlaceUrBetsPlease,” the XRP price is breaking out from a Symmetrical Triangle pattern, suggesting upward momentum. A Symmetrical Triangle is a chart pattern that signals a period of consolidation, showing no clear indication of a bullish or bearish feeling.
The analyst highlighted key resistance and support levels in his chart, projecting a new ATH target for the XRP price. He emphasized that the cryptocurrency has maintained a price above the weekly support area of $2.21, a critical level reinforcing its bullish position.
Currently, XRP is set to retest a new resistance level at $2.35, which the analyst suggests is required to trigger the cryptocurrency’s next upward push. The TradingView market expert has also revealed that after XRP’s breakout from the Symmetrical Triangle pattern, the next move is a massive price surge to $8.
The analyst’s projection aligns with Fibonacci extension levels, a technical tool for predicting potential price targets during an uptrend. In the presented chart, he suggested that the price levels at $4 (1.272 Fib), $6 (2.618 Fib), and $7 (3.618 Fib) would serve as potential resistance areas for XRP to overcome and hit a new ATH target of $8. This bullish target corresponds with the 4.236 Fibonacci extension level, marking a 1,500% surge from the initial breakout point.
Notably, the TradingView expert disclosed that his predicted XRP price target of $8 coincides with historical percentage gains observed during previous bull runs. The analyst also notes that XRP’s previous ATH above the $3.32 level, as indicated by the price chart, is within reach. The cryptocurrency achieved its all-time high of $3.84 during its bull rally in 2018, marking one of its most exponential price surges since its inception.
Expect A Pull Back Along The WayWhile the TradingView analyst remains significantly bullish on XRP’s price outlook, he also cautions about potential pullbacks and market volatility. He warns that investors and traders should be prepared for a possible 10%, 20%, and 30% price pullback as XRP moves towards its predicted target.
While these corrections may delay XRP’s price growth to $8, the analyst has reassured that pullbacks are expected in the cryptocurrency market, especially during strong uptrends. Based on CoinMarketCap’s data, the XRP price is currently trading at $2.45, meaning the cryptocurrency would need to rise by approximately 233% to reach an $8 ATH.
Why this matters
This altcoin story adds another data point to the current market tape and is useful when read alongside nearby source coverage.
Original source
Read on NewsBTCRelated market context

Dogecoin (DOGE) Price Prediction: DOGE Holds Near $0.084 as $0.09 Breakout Could Open $0.115
Dogecoin is back in the spotlight as price slips towards the $0.084 area, putting an important support zone under pressure. The la...

Bitcoin (BTC) Price Today: Whale Buying Strengthens Bullish Case as BTC Consolidates Near $79K
At the same time, technical indicators show that the recent rally has become stretched, leaving Bitcoin price caught between a con...
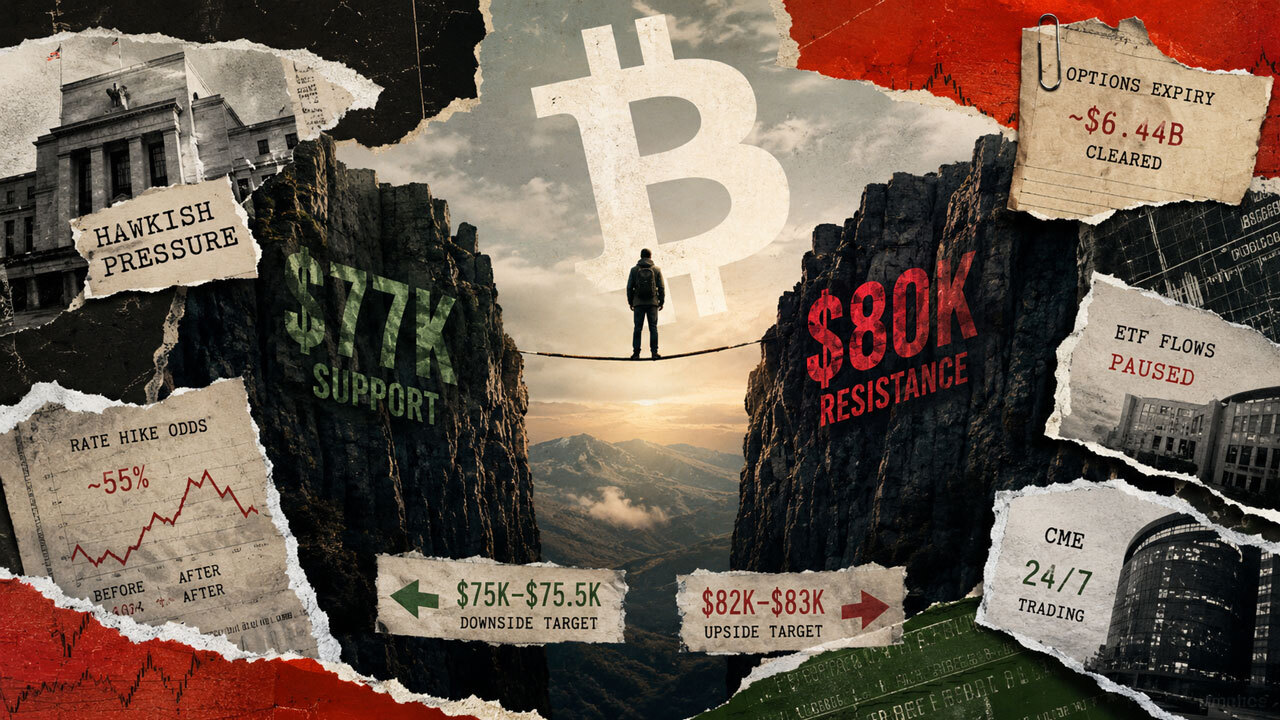
Bitcoin’s failed $81,000 breakout just put $75,000 back on the table
Bitcoin trades near $78,000 heading into the weekend, sitting almost between $77,000 support and $80,000 resistance after a sharp...

Bitcoin (BTC) Price Prediction: Hidden Weekly RSI Divergence Warns of Pullback as BTC Tests $80K
Bitcoin price was trading around $80,500 on Bitstamp in the latest technical reading, up 3.11% on the session. While the price rem...

Sui (SUI) Price Prediction: ETF Inflows and 100MA Support Strengthen $1.15 Outlook
Recent SUI price action has focused attention on the $0.73-$0.76 area, where several short- and medium-term moving averages are pr...

Bitcoin Price Prediction: Can BTC Get Back Over $80,000?
Today’s Bitcoin price prediction has BTC trading at $79,500, up around +1.1% over the past 24 hours, as the coin’s late-August gri...