XRP Price Bubble Burst? This Pattern Suggests Imminent Drop To $1.1
The XRP price has remained afloat in 2025 despite the uncertain market condition where several large-cap assets have floundered. However, the altcoin did little to absorb the bearish pressure that hit the market over the...
Archive context
Older archive item. Useful for background and entity history, but not a fresh market-moving signal.
The XRP price has remained afloat in 2025 despite the uncertain market condition where several large-cap assets have floundered. However, the altcoin did little to absorb the bearish pressure that hit the market over the past week.
According to data from CoinGecko, the price of XRP has declined by nearly 16% in the last seven days. A popular crypto analyst on social media platform X revealed that the altcoin’s woes might just be about to begin.
Here’s How XRP Is At Risk Of 50% PlungeIn a March 1 post on X, crypto pundit Ali Martinez put forward an interesting projection for the XRP price, saying the fourth-largest cryptocurrency is at risk of significant downward pressure in the near future. Martinez suggested that the value of XRP could be almost halved over the next few weeks.
This bearish forecast revolves around the formation of the head-and-shoulders pattern on the XRP chart on the 12-hour timeframe. The head-and-shoulders formation is a technical analysis pattern marked by three distinct swing highs, including a higher “head” between two lower “shoulders.”
This chart pattern signals a possible trend reversal; usually a shift from an uptrend to a downward price trend. This trend reversal can be confirmed when the asset price breaks down beneath the neckline, which is a trendline connecting the troughs (swing lows) between the head.
As shown in the above chart, the XRP price recently found support at the neckline around the $2 area before bouncing back toward $2.2. The price of XRP appears to be making a U-turn for a return to the neckline. If the altcoin does return, successfully breaches, and closes beneath the neckline, investors could see a shift to a downward trend.
In the head-and-shoulders formation, the price target is calculated by subtracting the height of the pattern (vertical distance between the head and the neckline) from the breakout point. Based on this strategy, the price of XRP could target the $1.1 mark (roughly 50% decline from the current price point) if it breaks below $2.
It is worth noting, though, that a strong 12-hour candlestick close above the $2.8 level would invalidate the current bearish outlook for the XRP price. Ultimately, if the XRP token reclaims $0.8, it could resume its bullish run and make a run for new highs in this cycle.
XRP Price At A GlanceAs of this writing, the price of XRP stands around $2.17, reflecting a 1% increase in the past 24 hours.
Featured image from iStock, chart from TradingViewWhy this matters
This altcoin story adds another data point to the current market tape and is useful when read alongside nearby source coverage.
Original source
Read on NewsBTCRelated market context

Bitcoin whales send 49,000 BTC to exchanges as $60K rebound shows signs of weakness
Bitcoin’s recovery above $60,000 is facing a fresh test from exchange-flow and derivatives data after large holders moved one of t...

XRP Price Prediction: SuperTrend Buy Signal Meets Shrinking Supply as $1.24 Breakout Comes Into Focus
After a fresh SuperTrend buy signal appeared on the 4-hour chart, analysts are watching whether the XRP price can extend its recen...

John Bollinger flags unusual fractal pattern in Bitcoin charts, eyes $65K breakout
Bollinger's fractal pattern suggests potential Bitcoin volatility, highlighting the importance of technical analysis in market pre...
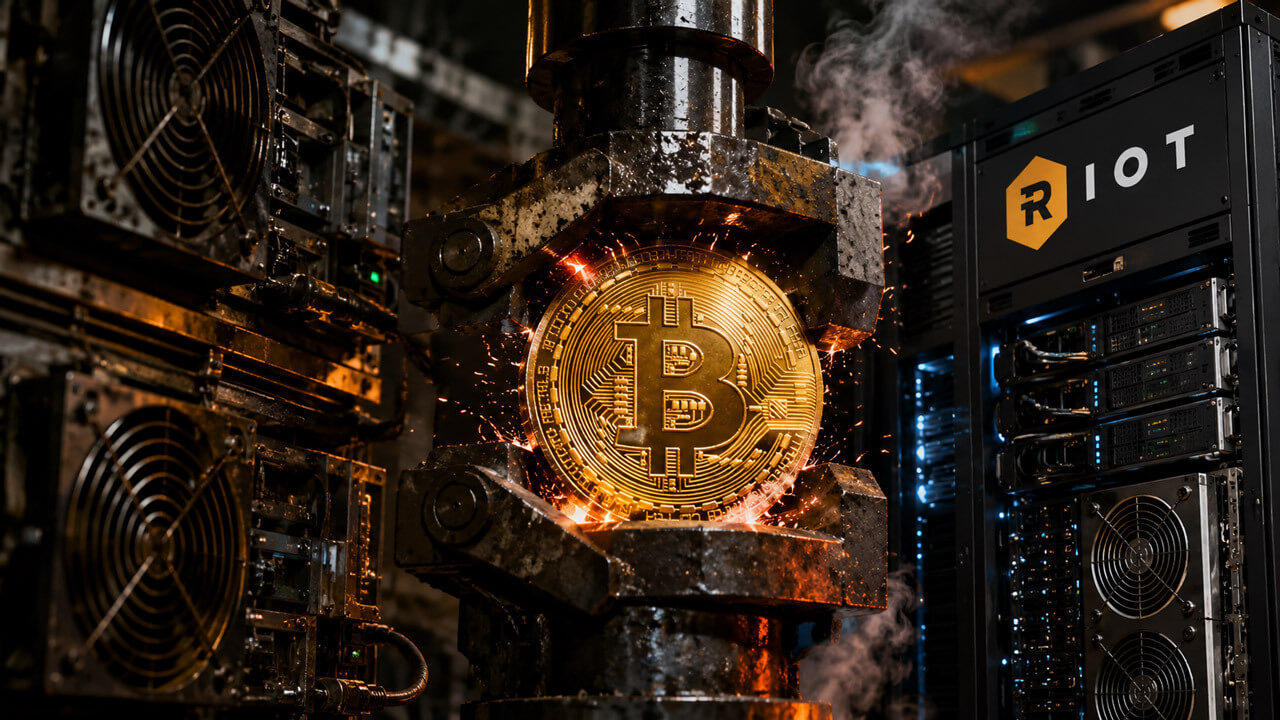
Reported Riot 500 BTC custody transfer exposes Bitcoin miners’ AI funding pressure
Riot Platforms' reported 500 BTC movement to NYDIG Custody gives the market a live signal for how public miners may use coin treas...
CryptoQuant says bitcoin and altcoin exchange deposits have spiked, indicating higher volatility ahead
Bitcoin deposits to exchanges recently climbed to nearly 49,000 BTC, "a rare extreme" seen only four other times this year, Crypto...

G2 Esports pushes past Nongshim RedForce 13-7 as crypto betting markets heat up around Valorant
G2's crypto partnerships highlight a growing trend in esports monetization, potentially reshaping investment strategies and market...