XRP Price Consolidates Surge, Ready for Another Leg Up?
XRP price started a major increase above $0.550 and $0.600. The price is now consolidating gains and facing hurdles near the $0.6480 zone. XRP price started a strong increase above the $0.550 and $0.580 levels. The price...

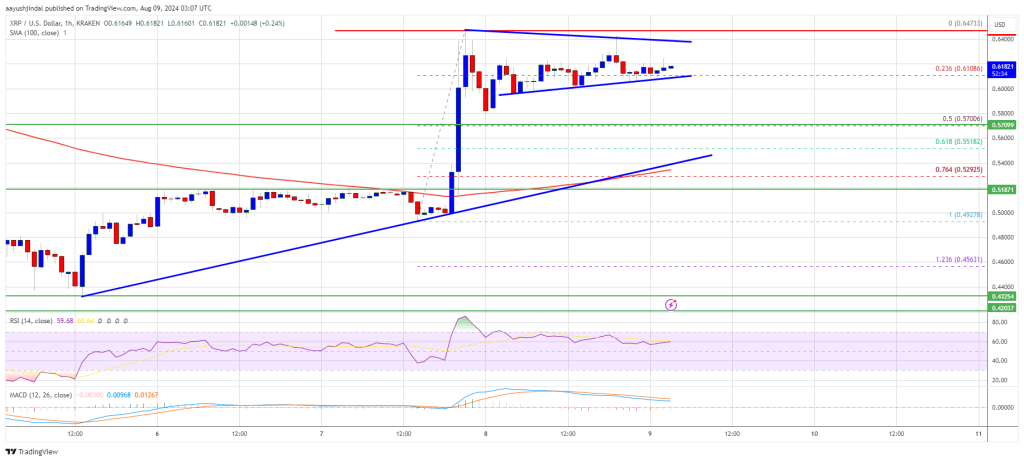
XRP price started a major increase above $0.550 and $0.600. The price is now consolidating gains and facing hurdles near the $0.6480 zone.
- XRP price started a strong increase above the $0.550 and $0.580 levels.
- The price is now trading above $0.600 and the 100-hourly Simple Moving Average.
- There is a key contracting triangle forming with resistance at $0.640 on the hourly chart of the XRP/USD pair (data source from Kraken).
- The pair could continue to rise if it clears the $0.640 resistance zone.
XRP price formed a base above $0.50 and started a major increase beating Ethereum and Bitcoin. The price was able to surpass the $0.550 and $0.580 resistance levels.
The bulls even pumped the price above the $0.60 resistance. A high was formed at $0.6473 and the price is now consolidating gains. There was a move below the $0.6120 level. The price dipped below the 23.6% Fib retracement level of the upward wave from the $0.4920 swing low to the $0.6477 high.
However, the bulls are active near $0.600. It is still trading above $0.600 and the 100-hourly Simple Moving Average. On the upside, the price is facing hurdles near the $0.6280 level.
The first major resistance is near the $0.6380 level. The next key resistance could be $0.640. There is also a key contracting triangle forming with resistance at $0.640 on the hourly chart of the XRP/USD pair. A clear move above the $0.640 resistance might send the price toward the $0.6550 resistance.
The next major resistance is near the $0.6720 level. Any more gains might send the price toward the $0.6880 resistance or even $0.700 in the near term.
Another Decline?If XRP fails to clear the $0.640 resistance zone, it could start a downside correction. Initial support on the downside is near the $0.6080 level. The next major support is at $0.600.
If there is a downside break and a close below the $0.600 level, the price might continue to decline toward the $0.570 support or the 50% Fib retracement level of the upward wave from the $0.4920 swing low to the $0.6477 high. The next major support sits at $0.550.
Technical Indicators
Hourly MACD – The MACD for XRP/USD is now losing pace in the bullish zone.
Hourly RSI (Relative Strength Index) – The RSI for XRP/USD is now above the 50 level.
Major Support Levels – $0.6080 and $0.5700.
Major Resistance Levels – $0.6250 and $0.6400.
Original source
Read on NewsBTCRelated market context

Google Gemini AI Predicts Jaw-Dropping XRP Price For Next 90 Days
Google Gemini AI just put XRP back under the spotlight, predicting it is tightly wound for a major breakout toward $1.60 to $1.80...

Standard Chartered Says Bitcoin Bottomed Near $59,000 As Crypto Winter Ends
TL;DR Standard Chartered’s Geoffrey Kendrick reportedly says Bitcoin’s $59,000 area marked the cycle bottom. The note cites SpaceX...

Elon Musk SpaceX AI Predicts Incredible Bitcoin Price For Next 30 Days
Here is the thing about capitulation calls. They only sound smart in hindsight. Right now, with Bitcoin price scraping along the l...

Bitcoin price challenges $64,000 weekend wall – needing a breakout or risk a deeper correction
Bitcoin reclaimed $64,000 on June 12 and touched an intraday high of $64,301 in the same session that spot ETF flows finally flipp...

Bitcoin rises above $64,000 after Pakistan prime minister says Iran peace deal is near
Bitcoin traded above $64,000 on Saturday, supported by its strongest ETF inflows in a month and growing optimism around geopolitic...

Are 24/7 CME Bitcoin futures a volatility cure — or a new leverage trap?
Wall Street got to trade Bitcoin around the clock just in time to watch the market fall apart. CME Group launched 24/7 trading for...