XRP Price Cracks $1.50 Support, Bears Eye Lower Targets Next
XRP price extended losses and traded below $1.50. The price is now consolidating losses but faces hurdles near $1.5320 and $1.550. XRP price started another decline and traded below the $1.5250 zone. The price is now tra...
Archive context
Older archive item. Useful for background and entity history, but not a fresh market-moving signal.
XRP price extended losses and traded below $1.50. The price is now consolidating losses but faces hurdles near $1.5320 and $1.550.
- XRP price started another decline and traded below the $1.5250 zone.
- The price is now trading below $1.50 and the 100-hourly Simple Moving Average.
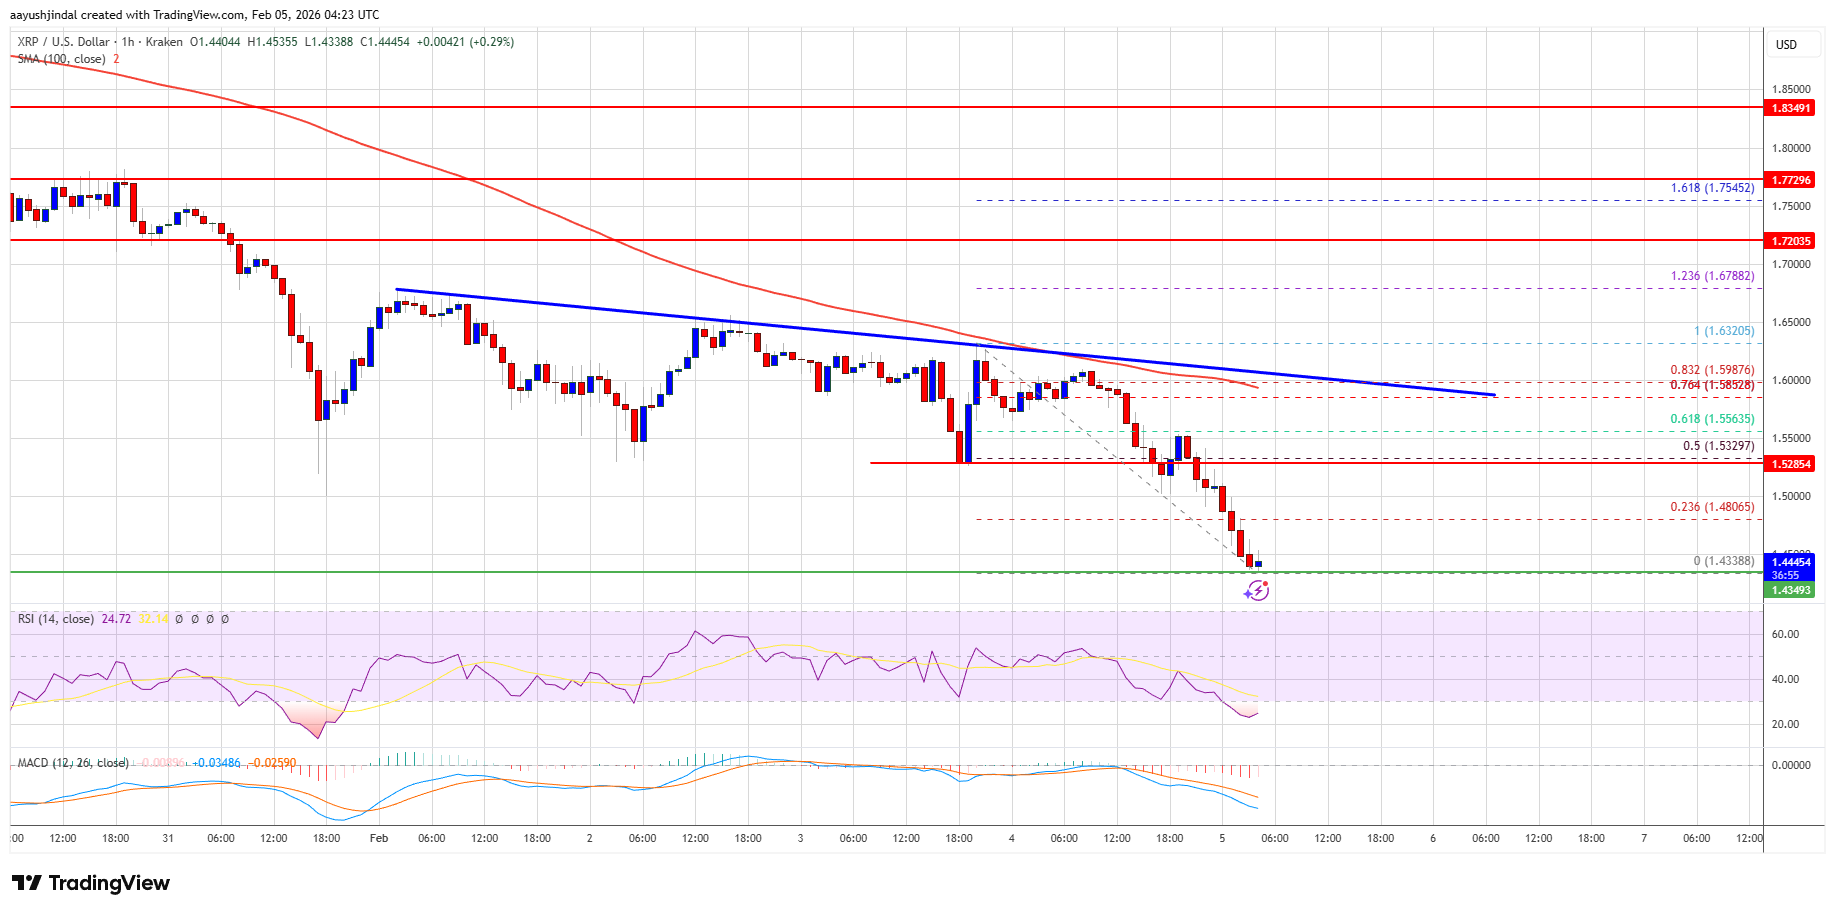
- There is a key bearish trend line forming with resistance at $1.5850 on the hourly chart of the XRP/USD pair (data source from Kraken).
- The pair could continue to move down if it stays below $1.60.
XRP price failed to stay above $1.5320 and extended its decline, like Bitcoin and Ethereum. The price declined below $1.5250 and $1.50 to enter a short-term bearish zone.
The price even extended losses below $1.4850. A low was formed at $1.4330, and the price is now consolidating losses with a bearish angle below the 23.6% Fib retracement level of the downward move from the $1.6322 swing high to the $1.4330 low but failed.
The price is now trading below $1.50 and the 100-hourly Simple Moving Average. There is also a bearish trend line forming with resistance at $1.5850 on the hourly chart of the XRP/USD pair.
If there is a fresh recovery move, the price might face resistance near the $1.480 level. The first major resistance is near the $1.5320 level or the 50% Fib retracement level of the downward move from the $1.6322 swing high to the $1.4330 low.
A close above $1.5320 could send the price to $1.5850. The next hurdle sits at $1.60. A clear move above the $1.60 resistance might send the price toward the $1.620 resistance. Any more gains might send the price toward the $1.650 resistance. The next major hurdle for the bulls might be near $1.70.
Another Drop?If XRP fails to clear the $1.5320 resistance zone, it could start a fresh decline. Initial support on the downside is near the $1.4320 level. The next major support is near the $1.4250 level.
If there is a downside break and a close below the $1.4250 level, the price might continue to decline toward $1.412. The next major support sits near the $1.4650 zone, below which the price could continue lower toward $1.450.
Technical Indicators
Hourly MACD – The MACD for XRP/USD is now gaining pace in the bearish zone.
Hourly RSI (Relative Strength Index) – The RSI for XRP/USD is now below the 50 level.
Major Support Levels – $1.4320 and $1.4250.
Major Resistance Levels – $1.5320 and $1.550.
Why this matters
XRP is a tracked market entity in the DigitalMoneyBox archive, making this useful context for readers monitoring repeated mentions and follow-up coverage.
Original source
Read on NewsBTCRelated market context

Ethereum Price Eyes $2,000 as AI Funds Shift From Chips to ETH, Says Tom Lee
Ethereum is pressing against a price level that has capped every rally. ETH trades at $1,925, little changed over the past 24 hour...

Ethereum News: Builder Activity & Leverage Data Align, $2k Next?
In Ethereum news today, new smart contract deployments on the network have surged 192% above the 90-day baseline, with funding rat...

XRP Price Could Turn Volatile This Month: What’s at Stake for Ripple?
XRP price is trading around $1.13, up about 2% over the past 24 hours. Those modest gains hide a much larger binary risk approachi...

Sky Protocol Revenue Nears $419M Annualized As USDS Demand Supports DeFi Income
Sky Protocol’s annualized gross revenue has climbed close to $419 million, according to its governance status dashboard, giving De...

Worldcoin (WLD) Price Prediction: Can Grayscale’s Worldcoin ETF Filing Trigger a WLD Rebound Above $0.45?
The filing has put the token back in focus at a time when WLD remains well below its recent 2026 highs and technical indicators co...
Bitcoin Price Prediction: Bitcoin Volatility Hits 2016 Low, Could Trigger Liquidations
Bitcoin price is trading around $66,100, after climbing above $66,500 earlier in the session, in a bullish prediction environment....