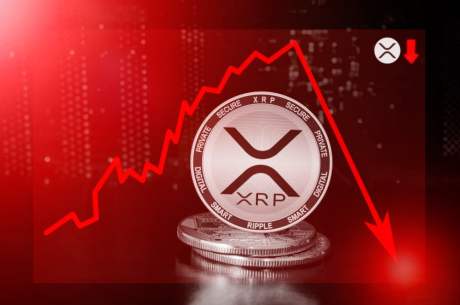
XRP Price Crashes Over 20%, Why Breakdown Looks Real Deal
Ripple’s token price is down over 20% against the US Dollar. XRP price is gaining bearish momentum and might revisit the $0.40 zone. Ripple’s token price is moving lower from the $0.620 resistance against the US dollar....
Archive context
Older archive item. Useful for background and entity history, but not a fresh market-moving signal.
Ripple’s token price is down over 20% against the US Dollar. XRP price is gaining bearish momentum and might revisit the $0.40 zone.
- Ripple’s token price is moving lower from the $0.620 resistance against the US dollar.
- The price is now trading below $0.55 and the 100 simple moving average (4 hours).
- There is a key bearish trend line forming with resistance near $0.585 on the 4-hour chart of the XRP/USD pair (data source from Kraken).
- The pair might continue to decline toward the $0.42 and $0.40 levels.
After struggling to rise above the $0.65 resistance, Ripple’s XRP started a fresh decline against the US Dollar. There was a strong decline below the $0.550 support zone, similar to Bitcoin and Ethereum.
The price is down over 20% and there was even a spike below $0.420. A low is formed near $0.3994 and the price is now attempting a recovery wave. There was a wave above the $0.45 resistance zone. The price climbed above the 23.6% Fib retracement level of the downward move from the $0.6365 swing high to the $0.3994 low.
XRP is now trading below $0.55 and the 100 simple moving average (4 hours). There is also a key bearish trend line forming with resistance near $0.585 on the 4-hour chart of the XRP/USD pair.
Initial resistance on the upside is near the $0.520 zone. It is close to the 50% Fib retracement level of the downward move from the $0.6365 swing high to the $0.3994 low. The next major resistance is near the $0.550 level. The main resistance is now forming near the $0.585 zone and the trend line.
Source: XRPUSD on TradingView.com
A successful break above the $0.585 resistance level might send the price toward the $0.62 resistance or the 100 simple moving average (4 hours). Any more gains might call for a test of the $0.650 resistance.
Another Decline in XRP?If ripple fails to clear the $0.550 resistance zone, it could start another decline. Initial support on the downside is near the $0.480 zone.
The next major support is near $0.455. If there is a downside break and a close below the $0.455 level, XRP’s price could extend losses. In the stated case, the price could retest the $0.400 support zone.
Technical Indicators
4-Hours MACD – The MACD for XRP/USD is now gaining pace in the bearish zone.
4-Hours RSI (Relative Strength Index) – The RSI for XRP/USD is now below the 50 level.
Major Support Levels – $0.48, $0.455, and $0.400.
Major Resistance Levels – $0.520, $0.550, and $0.585.
Why this matters
This altcoin story adds another data point to the current market tape and is useful when read alongside nearby source coverage.
Original source
Read on NewsBTCRelated market context

Ethereum (ETH) Price Prediction: ETH Holds Near $1,780 as Bulls Eye $1,860–$1,950, but $1,609 Remains Key Invalidation
Ethereum price is trading near $1,779 after a mixed 24-hour session, according to Brave New Coin data. ETH is down around 0.76% on...

Solana Price Prediction: SOL Holds Near $81 as Breakout Setup Points to $87, but Whale Flows Keep Risk Active
Solana price is back in focus after a sharp recovery pushed SOL towards the $81 area. The move has improved short-term momentum, e...

Hyperliquid (HYPE) Price Prediction: Symmetrical Triangle Breakout Puts $77 Target Back in Focus
The breakout comes after several sessions of price compression, with HYPE continuing to trade within a broader technical structure...

XRP Price Prediction: SuperTrend Buy Signal Meets Shrinking Supply as $1.24 Breakout Comes Into Focus
After a fresh SuperTrend buy signal appeared on the 4-hour chart, analysts are watching whether the XRP price can extend its recen...

Ethereum’s EIP-8222 wants to make staking anonymous, and it might actually work
EIP-8222 could enhance Ethereum's privacy, potentially boosting user confidence but also attracting regulatory scrutiny over anony...

Vitalik Buterin unveils “Lean Ethereum” roadmap for quantum resistance by 2029
Ethereum's proactive roadmap enhances its resilience and appeal, potentially boosting market confidence and investment in its futu...