XRP Price Fails To Ignite: Understanding The Downward Risks
XRP price is attempting to recover above the $0.4700 resistance zone. The price could decline again if it fails to clear the $0.4825 resistance zone. XRP price is still struggling to gain pace for a move above the $0.480...

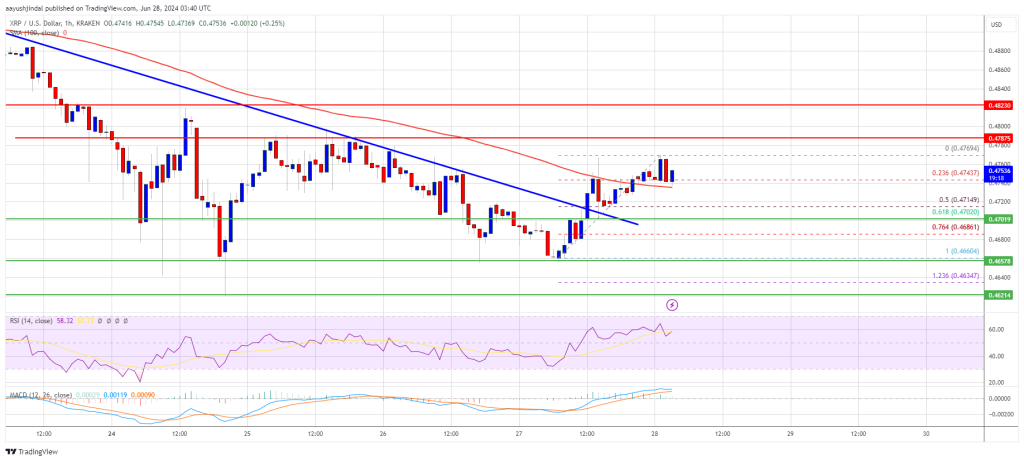
XRP price is attempting to recover above the $0.4700 resistance zone. The price could decline again if it fails to clear the $0.4825 resistance zone.
- XRP price is still struggling to gain pace for a move above the $0.4800 resistance zone.
- The price is now trading above $0.4720 and the 100-hourly Simple Moving Average.
- There was a break above a crucial bearish trend line with resistance at $0.4710 on the hourly chart of the XRP/USD pair (data source from Kraken).
- The pair might gain bullish momentum if there is a close above the $0.4825 resistance.
XRP price attempted a recovery wave above the $0.470 level like Bitcoin and Ethereum. The bulls were able to push the price above $0.4720 to push the price in a short-term bullish zone.
There was a break above a crucial bearish trend line with resistance at $0.4710 on the hourly chart of the XRP/USD pair. However, the pair is now facing resistance near the $0.4770 level. A high was formed at $0.4769 and the price is now consolidating losses.
The price is testing the 23.6% Fib retracement level of the upward move from the $0.4660 swing low to the $0.4769 high. It is now trading above $0.4720 and the 100-hourly Simple Moving Average.
On the upside, the price is facing resistance near the $0.4770 level. The first major resistance is near the $0.4785 level. The main hurdle is now near $0.4825. A clear move above the $0.4825 resistance might send the price toward the $0.4880 resistance.
The next major resistance is near the $0.500 level. A close above the $0.500 resistance zone could send the price higher toward $0.5120. Any more gains might send the price toward the $0.5250 resistance.
Another Decline?If XRP fails to clear the $0.4770 resistance zone, it could start another decline. Initial support on the downside is near the $0.4740 level and the 100-hourly Simple Moving Average.
The next major support is at $0.470. If there is a downside break and a close below the $0.4700 level, the price might continue to decline. In the stated case, the price could even trade below the $0.4620 support in the near term.
Technical Indicators
Hourly MACD – The MACD for XRP/USD is now losing pace in the bearish zone.
Hourly RSI (Relative Strength Index) – The RSI for XRP/USD is now above the 50 level.
Major Support Levels – $0.4700 and $0.4620.
Major Resistance Levels – $0.4770 and $0.4825.
Original source
Read on NewsBTCRelated market context

Standard Chartered Says Bitcoin Bottomed Near $59,000 As Crypto Winter Ends
TL;DR Standard Chartered’s Geoffrey Kendrick reportedly says Bitcoin’s $59,000 area marked the cycle bottom. The note cites SpaceX...

Bitcoin rises above $64,000 after Pakistan prime minister says Iran peace deal is near
Bitcoin traded above $64,000 on Saturday, supported by its strongest ETF inflows in a month and growing optimism around geopolitic...

XRP Price Prediction: Japan XRP ETF Listing is Getting Closer
Japan just handed XRP bulls a major regulatory tailwind. XRP price is retesting a congestion zone, and the prediction could turn b...

Elon Musk SpaceX AI Predicts Incredible Bitcoin Price For Next 30 Days
Here is the thing about capitulation calls. They only sound smart in hindsight. Right now, with Bitcoin price scraping along the l...

Bitcoin Mining Cost Model Points To $47,000 Floor, But Analysts Urge Caution
TL;DR Crypto Rover says Bitcoin has never bottomed below electrical production cost, currently estimated at $47,000. Mining-cost m...

Bitcoin price faces new risk as big buyers lose conviction
Bitcoin’s largest buyers are no longer behaving like a reliable backstop for the largest cryptocurrency. The exchange-traded funds...