XRP Price Falls Below Support, Bearish Momentum Builds
XRP price started another decline from the $0.5980 zone. It is gaining bearish momentum and might drop below the $0.5500 support zone. XRP price failed to clear the $0.60 resistance zone and trimmed gains. The price is n...

XRP price started another decline from the $0.5980 zone. It is gaining bearish momentum and might drop below the $0.5500 support zone.
- XRP price failed to clear the $0.60 resistance zone and trimmed gains.
- The price is now trading below $0.5720 and the 100-hourly Simple Moving Average.
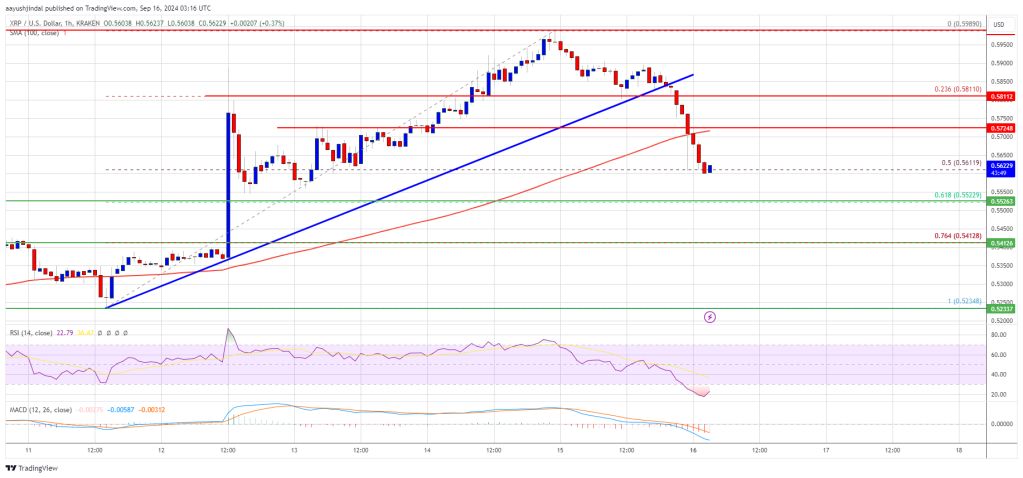
- There was a break below a key bullish trend line with support at $0.5850 on the hourly chart of the XRP/USD pair (data source from Kraken).
- The pair could decline heavily if there is a close below the $0.550 pivot level.
XRP price extended gains above the $0.550 level like Bitcoin and Ethereum. However, the bulls failed to clear the $0.600 resistance zone. The price formed a high at $0.5989 and the price is now correcting gains.
There was a move below the $0.5750 level. Besides, there was a break below a key bullish trend line with support at $0.5850 on the hourly chart of the XRP/USD pair. The pair tested the 50% Fib retracement level of the upward move from the $0.5234 swing low to the $0.5989 high.
The price is now trading below $0.5680 and the 100-hourly Simple Moving Average. On the upside, the price might face resistance near the $0.5720 level and the 100-hourly Simple Moving Average.
The first major resistance is near the $0.580 level. The next key resistance could be $0.5850. A clear move above the $0.5850 resistance might send the price toward the $0.5980 resistance. The next major resistance is near the $0.600 level. Any more gains might send the price toward the $0.6120 resistance or even $0.620 in the near term.
More Downsides?If XRP fails to clear the $0.5720 resistance zone, it could continue to move down. Initial support on the downside is near the $0.5550 level. The next major support is $0.5420 or the 76.4% Fib retracement level of the upward move from the $0.5234 swing low to the $0.5989 high.
If there is a downside break and a close below the $0.5420 level, the price might continue to decline toward the $0.530 support in the near term. The next major support sits at $0.5250.
Technical Indicators
Hourly MACD – The MACD for XRP/USD is now gaining pace in the bearish zone.
Hourly RSI (Relative Strength Index) – The RSI for XRP/USD is now below the 50 level.
Major Support Levels – $0.5550 and $0.5420.
Major Resistance Levels – $0.5720 and $0.5850.
Original source
Read on NewsBTCRelated market context

Standard Chartered Says Bitcoin Bottomed Near $59,000 As Crypto Winter Ends
TL;DR Standard Chartered’s Geoffrey Kendrick reportedly says Bitcoin’s $59,000 area marked the cycle bottom. The note cites SpaceX...

Are 24/7 CME Bitcoin futures a volatility cure — or a new leverage trap?
Wall Street got to trade Bitcoin around the clock just in time to watch the market fall apart. CME Group launched 24/7 trading for...

US forces shoot down Iranian attack drones near Strait of Hormuz, Bitcoin drops below $73K
Geopolitical tensions near vital oil routes can destabilize financial markets, highlighting the interconnectedness of global secur...

Elon Musk SpaceX AI Predicts Incredible Bitcoin Price For Next 30 Days
Here is the thing about capitulation calls. They only sound smart in hindsight. Right now, with Bitcoin price scraping along the l...

Bitcoin Mining Cost Model Points To $47,000 Floor, But Analysts Urge Caution
TL;DR Crypto Rover says Bitcoin has never bottomed below electrical production cost, currently estimated at $47,000. Mining-cost m...

Aave Proposal Moves To Add Circle Wrapped Bitcoin As Collateral
TL;DR Aave Labs has proposed onboarding Circle Wrapped Bitcoin, or cirBTC, to Aave V3 Core and Aave V4 Core on Ethereum. The propo...