XRP Price Gains Fade, Market Turns Cautious After Another Weak Session
XRP price failed to stay above $2.350 and trimmed gains. The price is now consolidating and might struggle to stay above $2.150 in the near term. XRP price failed to continue higher above $2.420 and corrected lower. The...

XRP price failed to stay above $2.350 and trimmed gains. The price is now consolidating and might struggle to stay above $2.150 in the near term.
- XRP price failed to continue higher above $2.420 and corrected lower.
- The price is now trading below $2.30 and the 100-hourly Simple Moving Average.
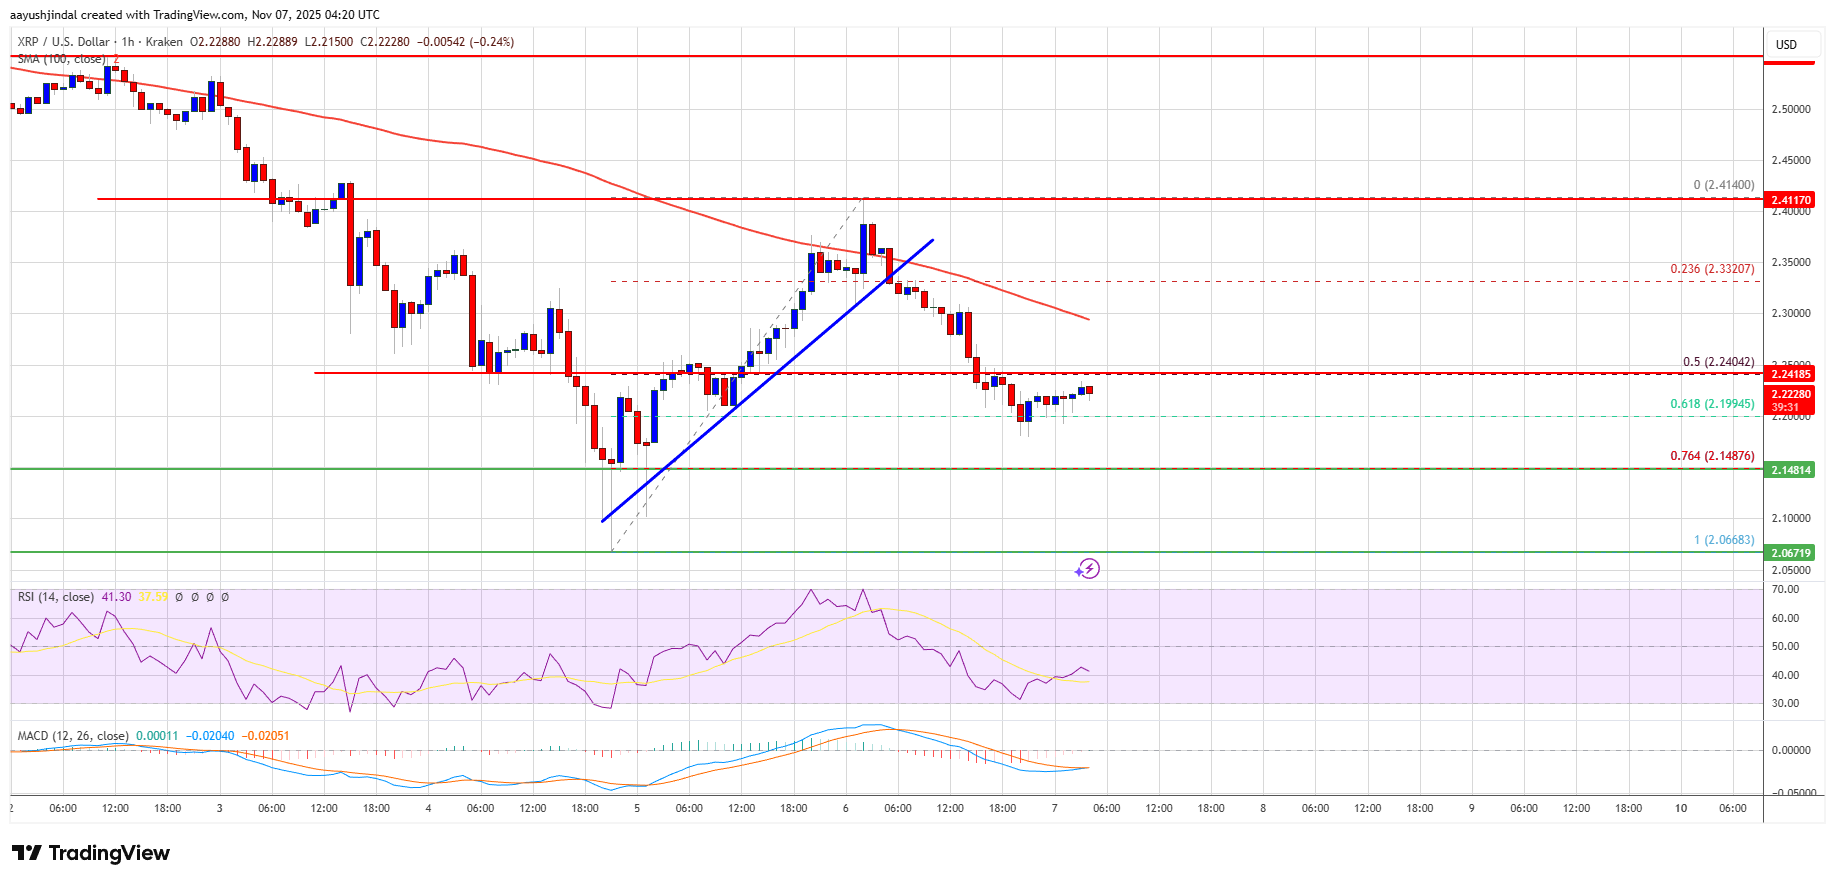
- There was a break below a bullish trend line with support at $2.360 on the hourly chart of the XRP/USD pair (data source from Kraken).
- The pair could continue to move down if it dips below $2.150.
XRP price started a recovery wave above $2.25 and $2.30, like Bitcoin and Ethereum. The price even attempted a move above $2.40 but failed to clear $2.42.
A high was formed at $2.414 and the price started a fresh decline. There was a drop below $2.33 and $2.32 levels. The price traded below the 50% Fib retracement level of the upward move from the $2.066 swing low to the $2.414 high.
Besides, there was a break below a bullish trend line with support at $2.360 on the hourly chart of the XRP/USD pair. The price is now trading below $2.30 and the 100-hourly Simple Moving Average.
The bulls are now active near $2.20 and the 61.8% Fib retracement level of the upward move from the $2.066 swing low to the $2.414 high. If there is a fresh upward move, the price might face resistance near the $2.30 level. The first major resistance is near the $2.350 level, above which the price could rise and test $2.420.
A clear move above the $2.420 resistance might send the price toward the $2.50 resistance. Any more gains might send the price toward the $2.550 resistance. The next major hurdle for the bulls might be near $2.650.
Another Decline?If XRP fails to clear the $2.30 resistance zone, it could start a fresh decline. Initial support on the downside is near the $2.20 level. The next major support is near the $2.150 level.
If there is a downside break and a close below the $2.150 level, the price might continue to decline toward $2.050. The next major support sits near the $2.00 zone, below which the price could continue lower toward $1.840.
Technical Indicators
Hourly MACD – The MACD for XRP/USD is now gaining pace in the bearish zone.
Hourly RSI (Relative Strength Index) – The RSI for XRP/USD is now below the 50 level.
Major Support Levels – $2.20 and $2.150.
Major Resistance Levels – $2.30 and $2.420.
Original source
Read on NewsBTCRelated market context

Bitcoin price faces new risk as big buyers lose conviction
Bitcoin’s largest buyers are no longer behaving like a reliable backstop for the largest cryptocurrency. The exchange-traded funds...

Ethereum Price Prediction: 3 Million ETH Rushes Into Staking as Sellers Vanish
Is nobody leaving Ethereum? A record 36 million ETH is now locked in staking, roughly 29–30% of the circulating supply, and the va...

Most Traders Will Scroll Past This Grok AI Bitcoin Predicts, Big Mistake
Elon Musk Grok AI just looked at a Bitcoin chart down more than 50% and predicts it’s a classic accumulation zone, targeting $150,...

XRP Price Prediction: Japan Regulates Crypto like Stocks, XRP to Benefit First
Japan just rewrote the rules. XRP price is battling below resistance at $1.10, but it’s prediction is getting bullish as Japan’s p...

XRP Price Prediction: Japan XRP ETF Listing is Getting Closer
Japan just handed XRP bulls a major regulatory tailwind. XRP price is retesting a congestion zone, and the prediction could turn b...

Ripple chases AI’s machine economy as XRPL stablecoins near $1 billion
Stablecoin liquidity on the XRP Ledger (XRPL) has nearly doubled over the past month, putting the network within reach of a $1 bil...