XRP Price its Wall at $1.45, Downside Risks Begin Building
XRP price failed to stay above $1.40 and started a downside correction. The price is now holding the $1.3680 support and might aim for another increase. XRP price started a downside correction and declined below $1.4250....

XRP price failed to stay above $1.40 and started a downside correction. The price is now holding the $1.3680 support and might aim for another increase.
- XRP price started a downside correction and declined below $1.4250.
- The price is now trading above $1.3680 and the 100-hourly Simple Moving Average.
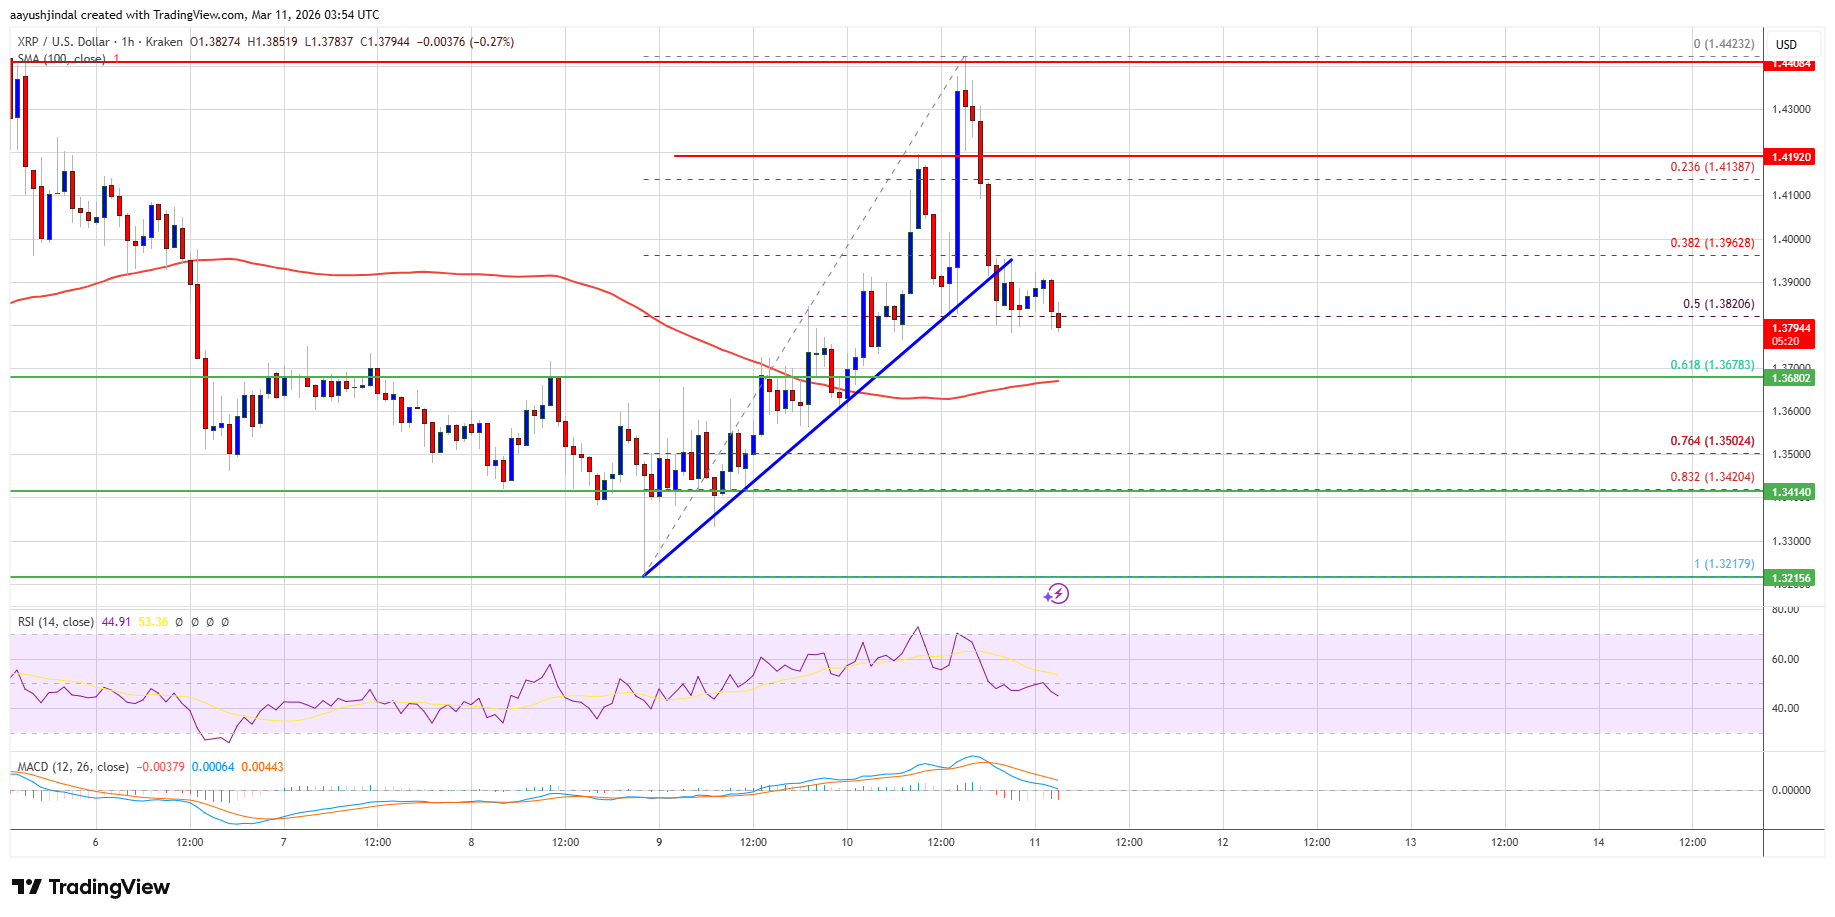
- There was a break below a bullish trend line with support at $1.3890 on the hourly chart of the XRP/USD pair (data source from Kraken).
- The pair could start another increase if it stays above $1.3680.
XRP price failed to stay above $1.4350 and started a downside correction, like Bitcoin and Ethereum. The price dipped below the $1.4250 and $1.4120 levels to enter a negative zone.
The price even dipped below the 50% Fib retracement level of the upward move from the $1.3217 swing low to the $1.4432 high. Besides, there was a break below a bullish trend line with support at $1.3890 on the hourly chart of the XRP/USD pair.
The price is now trading above $1.3680 and the 100-hourly Simple Moving Average. If there is a fresh upward move, the price might face resistance near the $1.3980 level. The first major resistance is near the $1.40 level, above which the price could rise and test $1.4250.
A clear move above the $1.4250 resistance might send the price toward the $1.450 resistance. Any more gains might send the price toward the $1.50 resistance. The next major hurdle for the bulls might be near $1.5250.
More Losses?If XRP fails to clear the $1.4250 resistance zone, it could start a fresh decline. Initial support on the downside is near the $1.3720 level. The next major support is near the $1.3680 level and the 61.8% Fib retracement level of the upward move from the $1.3217 swing low to the $1.4432 high.
If there is a downside break and a close below the $1.3680 level, the price might continue to decline toward $1.350. The next major support sits near the $1.3420 zone, below which the price could continue lower toward $1.3320. Any more losses might call for a test of $1.320.
Technical Indicators
Hourly MACD – The MACD for XRP/USD is now gaining pace in the bearish zone.
Hourly RSI (Relative Strength Index) – The RSI for XRP/USD is now below the 50 level.
Major Support Levels – $1.3720 and $1.3680.
Major Resistance Levels – $1.4250 and $1.4500.
Original source
Read on NewsBTCRelated market context

Ethereum Nears 200 Million Non-Empty Wallets Despite Market Uncertainty
Despite persistent market uncertainty and bearish sentiment across parts of the cryptocurrency sector, Ethereum is approaching a s...

Ethereum Price Prediction: 3 Million ETH Rushes Into Staking as Sellers Vanish
Is nobody leaving Ethereum? A record 36 million ETH is now locked in staking, roughly 29–30% of the circulating supply, and the va...

Ethereum Futures Just Hit A Binance Record: Are Traders Calling The Bottom?
Ethereum derivatives activity is flashing a fresh signal on Binance, where open interest measured in ETH terms has reached a new a...

Kraken Becomes Official Crypto Exchange Supporter Of FIFA World Cup 2026
TL;DR Kraken says it has become the Official Crypto Exchange Supporter of the FIFA World Cup 2026. The tournament expands to 48 te...

Most Traders Will Scroll Past This Grok AI Bitcoin Predicts, Big Mistake
Elon Musk Grok AI just looked at a Bitcoin chart down more than 50% and predicts it’s a classic accumulation zone, targeting $150,...

XRP Price Prediction: Japan Regulates Crypto like Stocks, XRP to Benefit First
Japan just rewrote the rules. XRP price is battling below resistance at $1.10, but it’s prediction is getting bullish as Japan’s p...