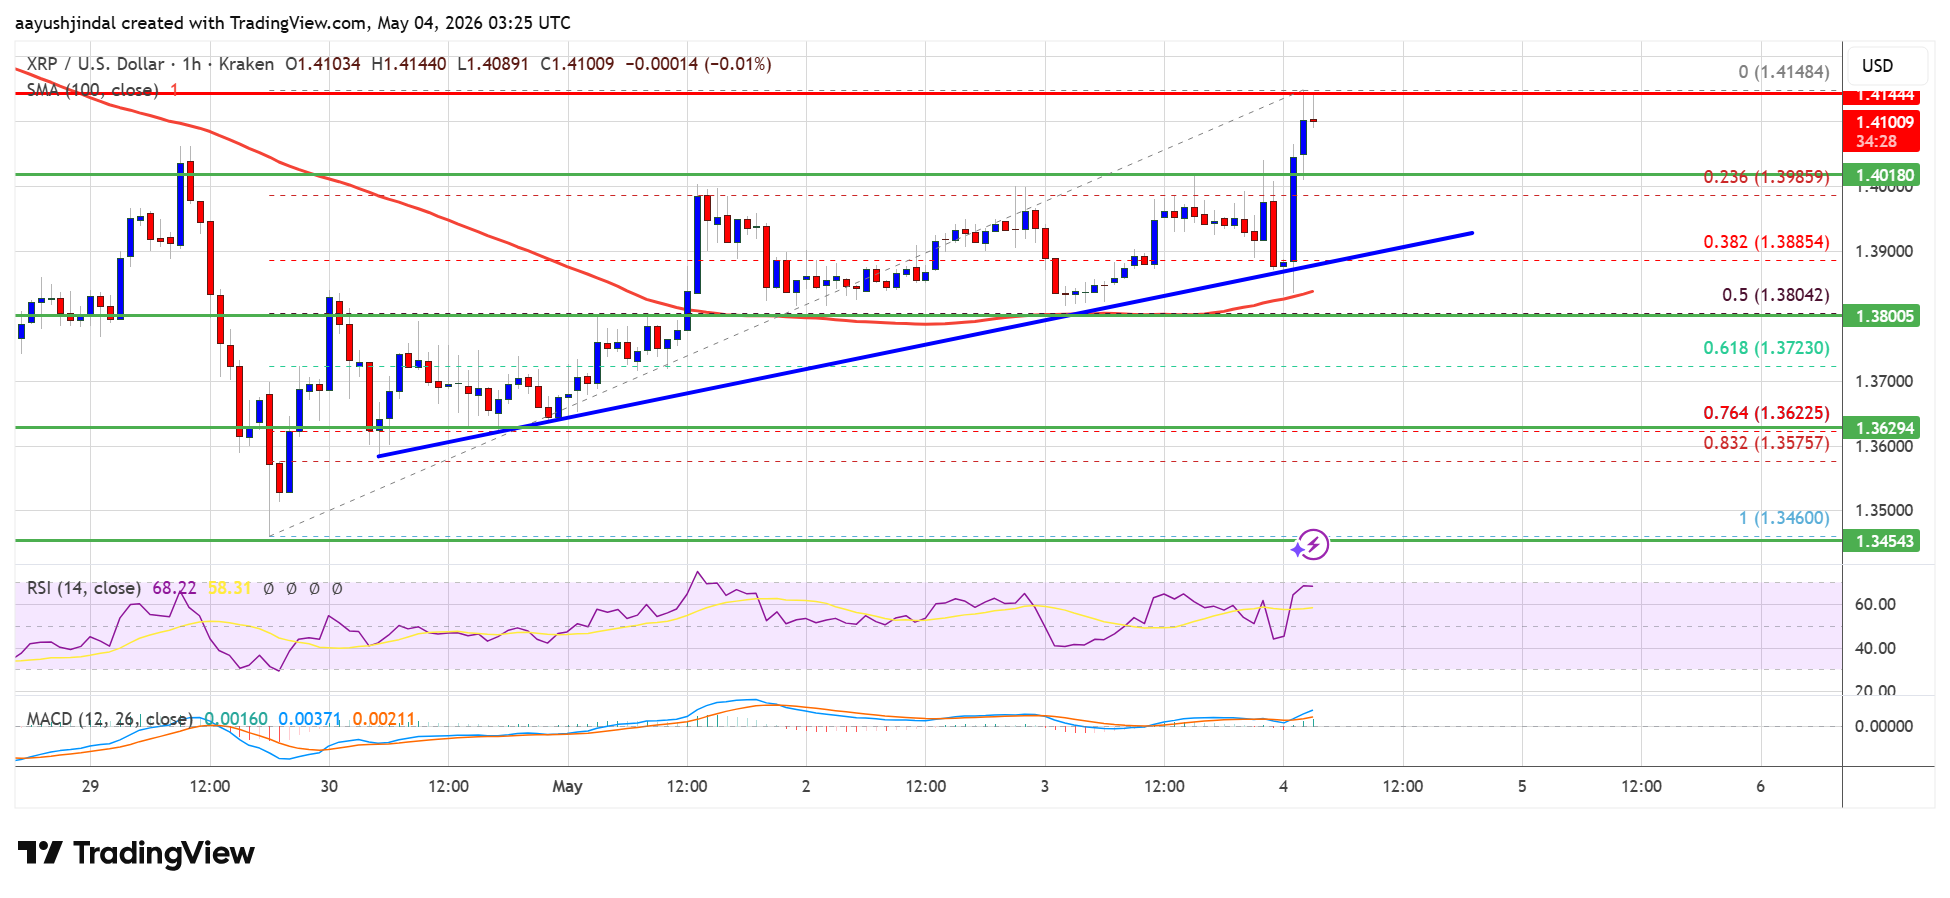
XRP Price Moves Up, Traders Eye Break Above $1.42 Level
XRP price started a decent increase above $1.3850. The price is now consolidating gains and might aim for more gains above the $1.420 zone. XRP price started a steady increase above the $1.40 zone. The price is now tradi...
Archive context
Older archive item. Useful for background and entity history, but not a fresh market-moving signal.

XRP price started a decent increase above $1.3850. The price is now consolidating gains and might aim for more gains above the $1.420 zone.
- XRP price started a steady increase above the $1.40 zone.
- The price is now trading above $1.40 and the 100-hourly Simple Moving Average.
- There is a bullish trend line forming with support at $1.3920 on the hourly chart of the XRP/USD pair (data source from Kraken).
- The pair could continue to move up if it settles above $1.420.
XRP price started a fresh upward move above $1.3880 and $1.3920, like Bitcoin and Ethereum. The price gained pace for a clear move above the $1.40 resistance.
The bulls even pumped the price toward the $1.4120 zone. A high was formed at $1.4148, and the price started a consolidation phase well above the 23.6% Fib retracement level of the upward move from the $1.3460 swing low to the $1.4148 high.
The price is now trading above $1.40 and the 100-hourly Simple Moving Average. Besides, there is a bullish trend line forming with support at $1.3920 on the hourly chart of the XRP/USD pair.
If there is a fresh upward move, the price might face resistance near the $1.4150 level. The first major resistance is near the $1.420 level, above which the price could rise and test $1.4350. A clear move above the $1.4350 resistance might send the price toward the $1.450 resistance. Any more gains might send the price toward the $1.480 resistance. The next major hurdle for the bulls might be near $1.50.
Downside Correction?If XRP fails to clear the $1.420 resistance zone, it could start a fresh decline. Initial support on the downside is near the $1.3880 level. The next major support is near the $1.380 level and the trend line or the 50% Fib retracement level of the upward move from the $1.3460 swing low to the $1.4148 high.
If there is a downside break and a close below the $1.380 level, the price might continue to decline toward $1.350. The next major support sits near the $1.3220 zone, below which the price could continue lower toward $1.3050. The main support could be $1.30.
Technical Indicators
Hourly MACD – The MACD for XRP/USD is now gaining pace in the bullish zone.
Hourly RSI (Relative Strength Index) – The RSI for XRP/USD is now above the 50 level.
Major Support Levels – $1.4000 and $1.3800.
Major Resistance Levels – $1.4200 and $1.4500.
Why this matters
XRP is a tracked market entity in the DigitalMoneyBox archive, making this useful context for readers monitoring repeated mentions and follow-up coverage.
Original source
Read on NewsBTCRelated market context

Ethereum (ETH) Price Prediction: $2,000 or $1,680 Next as ETH Reaches a Critical Turning Point
Ethereum price has fallen back below $1,900 after buyers failed to maintain the latest recovery, leaving ETH positioned between an...

Sam Altman ChatGPT AI Predicts a Historic XRP Price Move Before End of 2026
ChatGPT AI predicts a multi-year breakout for XRP, with the price prediction extending all the way to the end of 2027. From today’...
Ethereum just outpaced Bitcoin with $365 million in ETF inflows, but on-chain data shows the real bottom isn’t in yet
Ethereum outpaced Bitcoin in July as stronger investment-product demand and corporate accumulation powered its first sustained rel...

If Bitcoin breaks $62k over the weekend, a $1.1B short overhang stands ready to pull price down to $60k
Bitcoin enters the weekend near $62,900, less than 1% above the July 31 intraday low, and Deribit has already settled roughly $9.6...

Bitcoin (BTC) Price Prediction: TD Sequential Sell Signal and Weak August History Raise Pullback Risks
The latest market snapshots show Bitcoin trading near $63,000–$64,000, with traders watching whether support around $62,800 can ho...

Bitcoin And Ethereum Edge Higher As Traders Watch Altcoin Rotation
Bitcoin and Ethereum edged higher into July 31, while a small shift in market dominance suggested traders were again watching whet...