XRP Price on Edge: Potential Slide Resumption Looms
XRP price failed to recover above the $0.50 resistance zone. The price is again moving lower and there is risk of more downsides below $0.4840. XRP is still showing bearish signs and struggled near $0.50. The price is no...

XRP price failed to recover above the $0.50 resistance zone. The price is again moving lower and there is risk of more downsides below $0.4840.
- XRP is still showing bearish signs and struggled near $0.50.
- The price is now trading below $0.4920 and the 100-hourly Simple Moving Average.
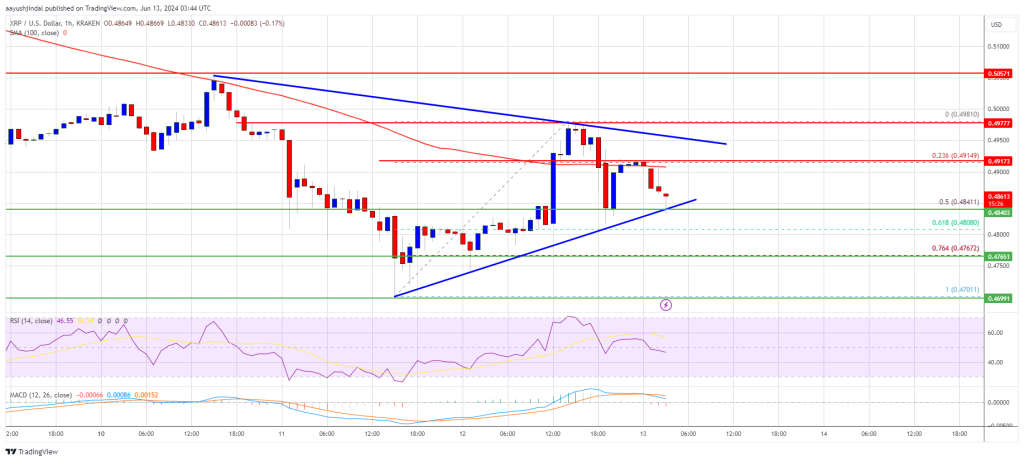
- There is a key contracting triangle forming with resistance at $0.4950 on the hourly chart of the XRP/USD pair (data source from Kraken).
- The pair could recover, but the bears might be active near the $0.4950 resistance.
XRP price failed to recover above the $0.50 resistance like Ethereum and Bitcoin. The price peaked near the $0.4981 level and recently started another decline.
There was a move below the $0.4980 and $0.4950 levels. The price declined below the 23.6% Fib retracement level of the upward move from the $0.4701 swing low to the $0.4981 high. It is now trading below $0.4920 and the 100-hourly Simple Moving Average.
The bulls are now active near the $0.4840 support and the 50% Fib retracement level of the upward move from the $0.4701 swing low to the $0.4981 high.
On the upside, the price is facing resistance near the $0.4920 level. The first key resistance is near $0.4950. There is also a key contracting triangle forming with resistance at $0.4950 on the hourly chart of the XRP/USD pair. The next major resistance is near the $0.50 level.
A close above the $0.50 resistance zone could send the price higher. The next key resistance is near $0.5050. If there is a close above the $0.5050 resistance level, there could be a steady increase toward the $0.5250 resistance. Any more gains might send the price toward the $0.5320 resistance.
More Losses?If XRP fails to clear the $0.4950 resistance zone, it could continue to move down. Initial support on the downside is near the $0.4840 level.
The next major support is at $0.4765. If there is a downside break and a close below the $0.4765 level, the price might accelerate lower. In the stated case, the price could decline and retest the $0.4550 support in the near term.
Technical Indicators
Hourly MACD – The MACD for XRP/USD is now gaining pace in the bearish zone.
Hourly RSI (Relative Strength Index) – The RSI for XRP/USD is now below the 50 level.
Major Support Levels – $0.4840 and $0.4765.
Major Resistance Levels – $0.4950 and $0.5000.
Original source
Read on NewsBTCRelated market context

Standard Chartered Says Bitcoin Bottomed Near $59,000 As Crypto Winter Ends
TL;DR Standard Chartered’s Geoffrey Kendrick reportedly says Bitcoin’s $59,000 area marked the cycle bottom. The note cites SpaceX...

Bitcoin price faces new risk as big buyers lose conviction
Bitcoin’s largest buyers are no longer behaving like a reliable backstop for the largest cryptocurrency. The exchange-traded funds...

Bitcoin Mining Cost Model Points To $47,000 Floor, But Analysts Urge Caution
TL;DR Crypto Rover says Bitcoin has never bottomed below electrical production cost, currently estimated at $47,000. Mining-cost m...

Bitcoin rises above $64,000 after Pakistan prime minister says Iran peace deal is near
Bitcoin traded above $64,000 on Saturday, supported by its strongest ETF inflows in a month and growing optimism around geopolitic...

Are 24/7 CME Bitcoin futures a volatility cure — or a new leverage trap?
Wall Street got to trade Bitcoin around the clock just in time to watch the market fall apart. CME Group launched 24/7 trading for...

US forces shoot down Iranian attack drones near Strait of Hormuz, Bitcoin drops below $73K
Geopolitical tensions near vital oil routes can destabilize financial markets, highlighting the interconnectedness of global secur...