XRP Price Prediction – Downside Thrust Possible Before Fresh Surge To $0.72
XRP price is moving lower from the $0.732 resistance. The price is now at risk of more losses toward the $0.550 support before the bulls take a stand. XRP started a downside correction below $0.638 and $0.612. The price...
Archive context
Older archive item. Useful for background and entity history, but not a fresh market-moving signal.

XRP price is moving lower from the $0.732 resistance. The price is now at risk of more losses toward the $0.550 support before the bulls take a stand.
- XRP started a downside correction below $0.638 and $0.612.
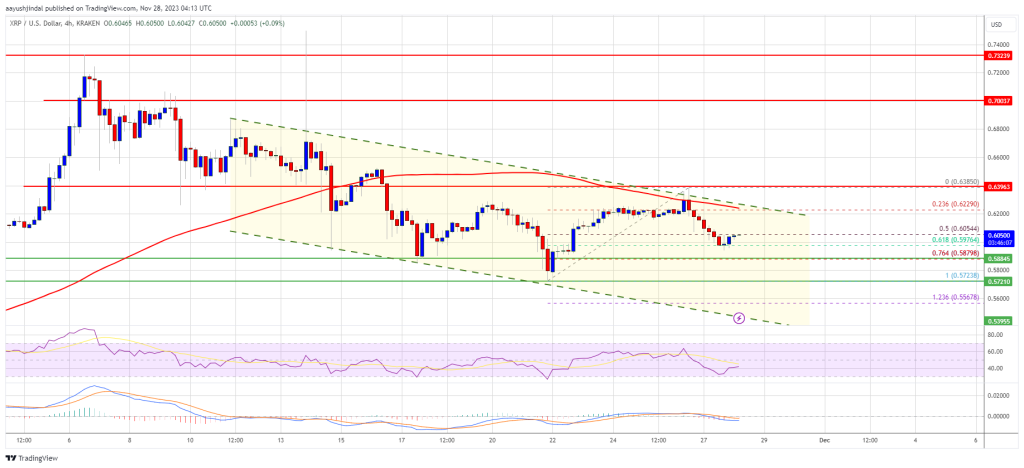
- The price is now trading below $0.625 and the 100 simple moving average (4 hours).
- There is a key declining channel forming with resistance near $0.622 on the 4-hour chart of the XRP/USD pair (data source from Kraken).
- The pair dive toward the $0.550 support before the bulls take a stand.
In the past few days, XRP saw a steady decline from the $0.740 zone. There was a move below the $0.685 and $0.638 support levels. The price even dived below the $0.612 support, underperforming Bitcoin and Ethereum.
There was a recovery wave from $0.572, but the bears were active near $0.638. A high was formed near $0.6385 and the price is now moving lower. There was a break below the 50% Fib retracement level of the upward move from the $0.5723 swing low to the $0.6385 high.
XRP is now trading below $0.625 and the 100 simple moving average (4 hours). There is also a key declining channel forming with resistance near $0.622 on the 4-hour chart.
On the upside, immediate resistance is near the $0.615 level. The first major resistance is near the $0.622 zone or the 100 simple moving average (4 hours) or the channel upper zone. A close above the $0.622 resistance zone could spark a steady increase.
Source: XRPUSD on TradingView.com
The next key resistance is near $0.638. If the bulls remain in action above the $0.638 resistance level, there could be a rally toward the $0.700 resistance. Any more gains might send XRP toward the $0.720 resistance.
More Downsides?If XRP fails to clear the $0.622 resistance zone, it could start a fresh decline. Initial support on the downside is near the $0.588 zone.
The next major support is at $0.572. If there is a downside break and a close below the $0.572 level, XRP price might accelerate lower. In the stated case, the price could retest the $0.540 support zone.
Technical Indicators
4-Hours MACD – The MACD for XRP/USD is now gaining pace in the bearish zone.
4-Hours RSI (Relative Strength Index) – The RSI for XRP/USD is now below the 50 level.
Major Support Levels – $0.588, $0.572, and $0.540.
Major Resistance Levels – $0.622, $0.638, and $0.700.
Why this matters
This altcoin story adds another data point to the current market tape and is useful when read alongside nearby source coverage.
Original source
Read on NewsBTCRelated market context

XRP Price Prediction: SuperTrend Buy Signal Meets Shrinking Supply as $1.24 Breakout Comes Into Focus
After a fresh SuperTrend buy signal appeared on the 4-hour chart, analysts are watching whether the XRP price can extend its recen...

XRP vs Bitcoin: Investor Says RLUSD Growth and Regulatory Clarity Could Shift Crypto’s Balance of Power
While the claim remains highly ambitious given Bitcoin’s commanding lead in market capitalization, the discussion highlights broad...

Bitcoin whales send 49,000 BTC to exchanges as $60K rebound shows signs of weakness
Bitcoin’s recovery above $60,000 is facing a fresh test from exchange-flow and derivatives data after large holders moved one of t...

Leading Claude AI Fable 5 Predicts Stunning XRP Price by The End of 2026
Anthropic’s new Claude AI model, Fable 5, predicts XRP price for the entire second half around a single event that could be resolv...

Bitcoin Rebounds Toward $63,000, But ETF Flows Still Hold The Key
Bitcoin has started the new week with a little more colour on the screen. After sliding through the kind of levels that usually tr...

Vitalik Buterin unveils “Lean Ethereum” roadmap for quantum resistance by 2029
Ethereum's proactive roadmap enhances its resilience and appeal, potentially boosting market confidence and investment in its futu...