XRP Price Prediction – Indicators Suggest Fresh Bull Run If XRP Clears $0.642
XRP price started a downside correction and tested $0.572. The price is now rising and might gain bullish momentum if it clears $0.642. XRP started a downside correction below $0.650 and $0.620. The price is now trading...
Archive context
Older archive item. Useful for background and entity history, but not a fresh market-moving signal.

XRP price started a downside correction and tested $0.572. The price is now rising and might gain bullish momentum if it clears $0.642.
- XRP started a downside correction below $0.650 and $0.620.
- The price is now trading below $0.640 and the 100 simple moving average (4 hours).
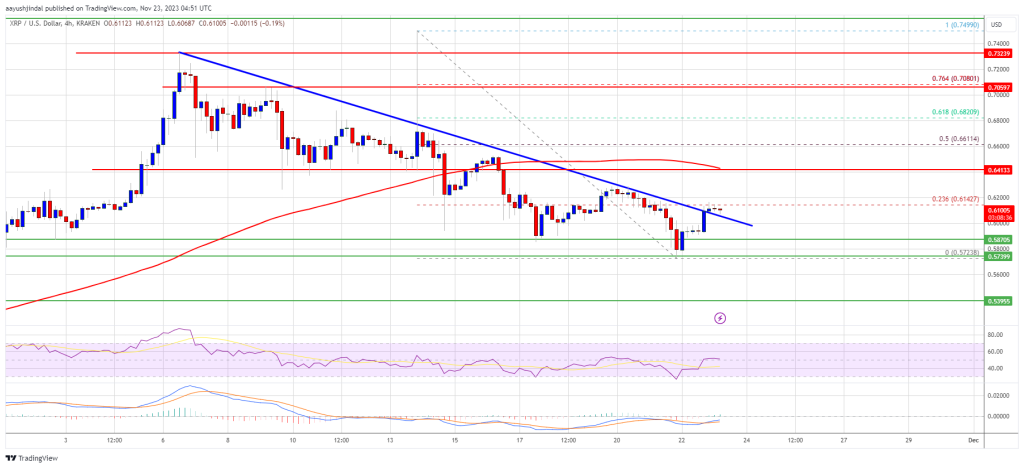
- There was a break above a major bearish trend line with resistance near $0.608 on the 4-hour chart of the XRP/USD pair (data source from Kraken).
- The pair start a fresh rally if it clears the $0.642 resistance zone.
After facing rejection near the $0.740 zone, XRP started a fresh decline. There was a move below the $0.70 and $0.650 support levels. The price even dived below the $0.60 support, underperforming Bitcoin and Ethereum.
Finally, the bulls took a stand near $0.572. A low was formed near $0.572 and the price is now attempting a fresh increase. There was a move above the $0.600 resistance. There was a break above a major bearish trend line with resistance near $0.608 on the 4-hour chart of the XRP/USD pair.
The price is now testing the 23.6% Fib retracement level of the downward move from the $0.7499 swing high to the $0.5723 low. On the upside, immediate resistance is near the $0.615 level.
The first major resistance is near the $0.642 zone or the 100 simple moving average (4 hours). It is close to the 50% Fib retracement level of the downward move from the $0.7499 swing high to the $0.5723 low. A close above the $0.642 resistance zone could spark a steady increase.
Source: XRPUSD on TradingView.com
The next key resistance is near $0.682. If the bulls remain in action above the $0.682 resistance level, there could be a rally toward the $0.720 resistance. Any more gains might send XRP toward the $0.750 resistance.
Another Decline?If XRP fails to clear the $0.642 resistance zone, it could start a fresh decline. Initial support on the downside is near the $0.588 zone.
The next major support is at $0.572. If there is a downside break and a close below the $0.572 level, XRP price might accelerate lower. In the stated case, the price could retest the $0.540 support zone.
Technical Indicators
4-Hours MACD – The MACD for XRP/USD is now gaining pace in the bullish zone.
4-Hours RSI (Relative Strength Index) – The RSI for XRP/USD is now just above the 50 level.
Major Support Levels – $0.588, $0.572, and $0.540.
Major Resistance Levels – $0.615, $0.642, and $0.682.
Why this matters
This altcoin story adds another data point to the current market tape and is useful when read alongside nearby source coverage.
Original source
Read on NewsBTCRelated market context

XRP Price Prediction: SuperTrend Buy Signal Meets Shrinking Supply as $1.24 Breakout Comes Into Focus
After a fresh SuperTrend buy signal appeared on the 4-hour chart, analysts are watching whether the XRP price can extend its recen...

Mark Zuckerberg’s Meta AI Predicts Unbelievable Bitcoin Price by the End of 2026
Mark Zuckerberg’s Meta AI predicts and stacks 4 numbered catalysts behind its Bitcoin price prediction that puts $120,000 to $150,...

Bitcoin whales send 49,000 BTC to exchanges as $60K rebound shows signs of weakness
Bitcoin’s recovery above $60,000 is facing a fresh test from exchange-flow and derivatives data after large holders moved one of t...

Leading Claude AI Fable 5 Predicts Stunning XRP Price by The End of 2026
Anthropic’s new Claude AI model, Fable 5, predicts XRP price for the entire second half around a single event that could be resolv...

Vitalik Buterin unveils “Lean Ethereum” roadmap for quantum resistance by 2029
Ethereum's proactive roadmap enhances its resilience and appeal, potentially boosting market confidence and investment in its futu...

Micron stock soars nearly 700% in a year as tokenized version trades on Ethereum via Ondo
Micron's stock surge and tokenization highlight the growing intersection of traditional finance and decentralized finance, impacti...