XRP Price Prediction: Smashing This Resistance Might Trigger Rally
Ripple is showing positive signs above the $0.365 support against the US Dollar. XRP price seems to be eyeing a fresh rally towards the $0.48 level. Ripple is slowly moving higher and trading above $0.35 against the US d...

Ripple is showing positive signs above the $0.365 support against the US Dollar. XRP price seems to be eyeing a fresh rally towards the $0.48 level.
- Ripple is slowly moving higher and trading above $0.35 against the US dollar.
- The price is now trading above $0.380 and the 100 simple moving average (4-hours).
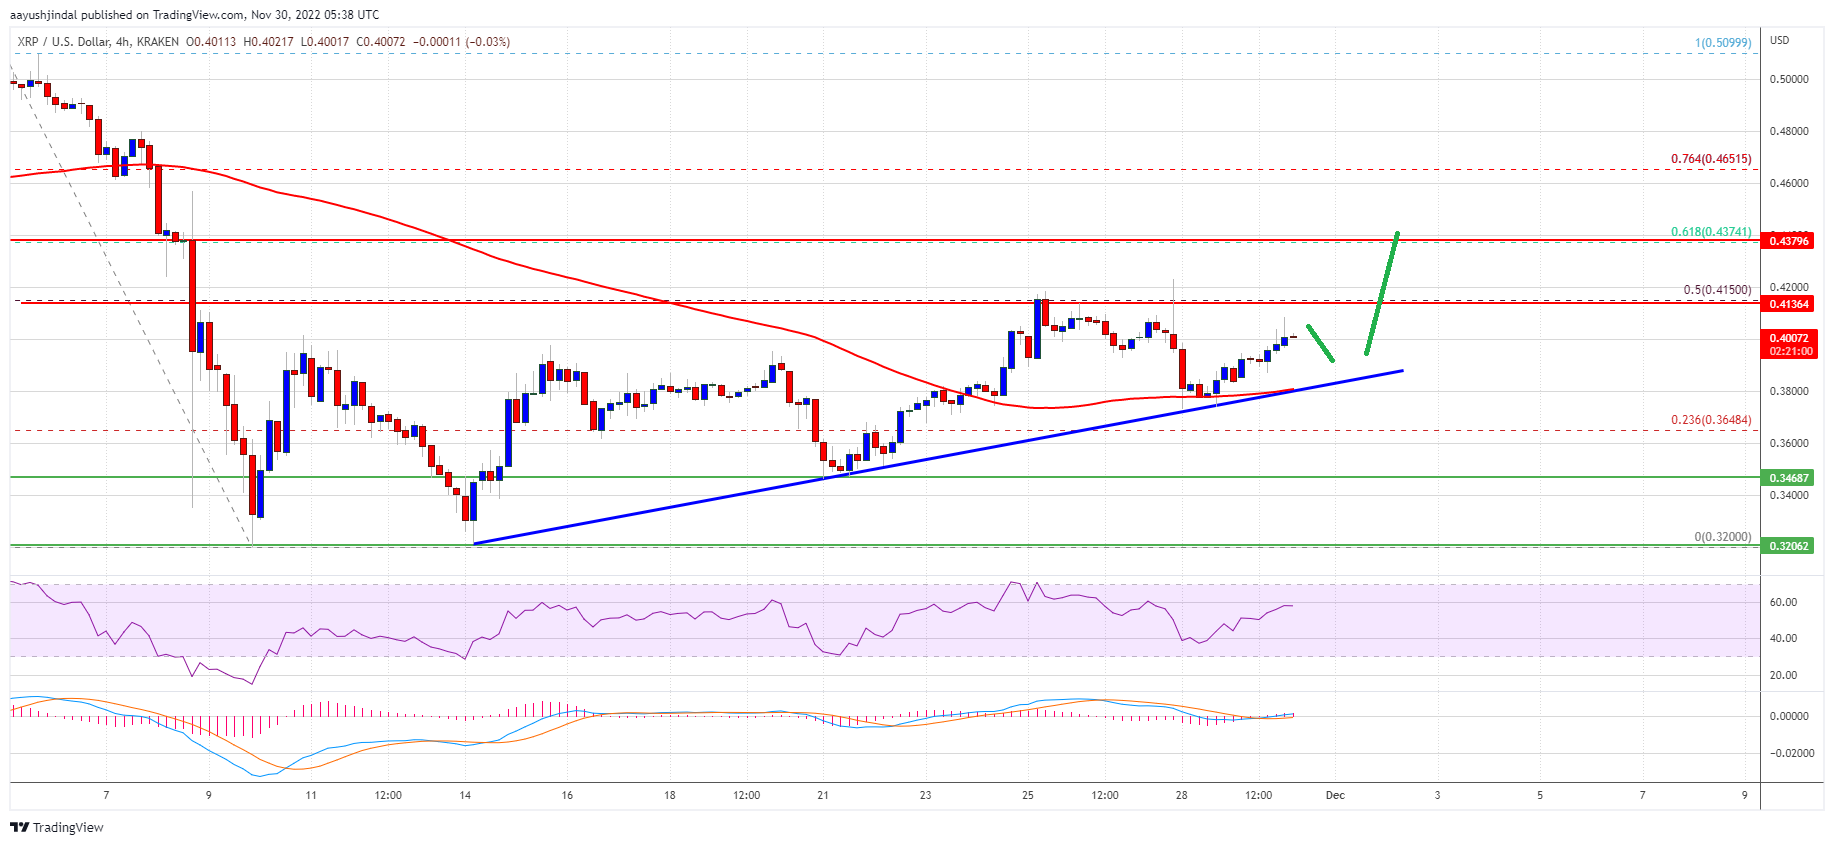
- There is a key bullish trend line forming with support near $0.381 on the 4-hours chart of the XRP/USD pair (data source from Kraken).
- The pair could start a strong increase if it clears the $0.415 resistance zone.
After a strong decline, ripple’s XRP found support near the $0.320 zone against the US Dollar. The price started a decent increase above the $0.332 and $0.350 resistance levels.
The bulls were able to lift the price above the 23.6% Fib retracement level of the key drop from the $0.5098 swing high to $0.3200 swing low. xrp price is now trading above $0.380 and the 100 simple moving average (4-hours). There is also a key bullish trend line forming with support near $0.381 on the 4-hours chart of the XRP/USD pair.
It seems to be facing a major resistance near the $0.415 level. It is close to the 50% Fib retracement level of the key drop from the $0.5098 swing high to $0.3200 swing low. The next major resistance is near the $0.438 level.
Source: XRPUSD on TradingView.com
A successful break above the $0.438 resistance might send the price towards the $0.465 resistance. The next key resistance is near the $0.480 level. Any more gains might send the price towards the $0.50 level in the coming days.
Dips Limited in XRP?If ripple fails to clear the $0.415 resistance zone, it could start a downside correction. An initial support on the downside is near the $0.381 level, the trend line, and the 100 simple moving average (4-hours).
The next major support is near $0.350. If there is a downside break and close below the $0.350 level, xrp price could extend losses. In the stated case, the price could even decline below the $0.320 support.
Technical Indicators
4-Hours MACD – The MACD for XRP/USD is now gaining pace in the bullish zone.
4-Hours RSI (Relative Strength Index) – The RSI for XRP/USD is now above the 50 level.
Major Support Levels – $0.381, $0.365 and $0.350.
Major Resistance Levels – $0.415, $0.438 and $0.480.
Original source
Read on NewsBTCRelated market context

Uranium Holds Above $85 as Mining ETF Rebounds From June Sell-Off
The latest charts display that the market is divided into stable physical prices and uranium shares trying to regain momentum afte...

Bitcoin price challenges $64,000 weekend wall – needing a breakout or risk a deeper correction
Bitcoin reclaimed $64,000 on June 12 and touched an intraday high of $64,301 in the same session that spot ETF flows finally flipp...

Bitcoin rises above $64,000 after Pakistan prime minister says Iran peace deal is near
Bitcoin traded above $64,000 on Saturday, supported by its strongest ETF inflows in a month and growing optimism around geopolitic...

Standard Chartered Says Bitcoin Bottomed Near $59,000 As Crypto Winter Ends
TL;DR Standard Chartered’s Geoffrey Kendrick reportedly says Bitcoin’s $59,000 area marked the cycle bottom. The note cites SpaceX...

Google Gemini AI Predicts Jaw-Dropping XRP Price For Next 90 Days
Google Gemini AI just put XRP back under the spotlight, predicting it is tightly wound for a major breakout toward $1.60 to $1.80...

Ripple CEO Accused Jamie Dimon of Lying About CLARITY Act And Called Out $20Bn Reason Why
Ripple CEO Brad Garlinghouse went directly at JPMorgan chief Jamie Dimon on Fox Business Wednesday, accusing him of ‘intentional m...