XRP Price Prediction: XRP Loses Multi-Month Support After Weekly EMA Rejection, Is a Drop Toward $0.80 Now Likely?
The latest technical charts suggest bearish momentum remains intact, while on-chain data points to a handful of important price zones where buyers could attempt to slow the decline. Although some momentum indicators now...
Archive context
Older archive item. Useful for background and entity history, but not a fresh market-moving signal.

The latest technical charts suggest bearish momentum remains intact, while on-chain data points to a handful of important price zones where buyers could attempt to slow the decline. Although some momentum indicators now hint that selling pressure may be easing, broader trend signals continue to favor caution.
With the current XRP price hovering near $1.05, traders are closely watching whether the token can stabilize above immediate support or extend its correction toward lower historical demand areas.
XRP Breaks Key Trendline as Weekly Indicators Turn BearishThe latest chart shared by market analyst ChartNerdTA on June 28 shows XRP losing its multi-month ascending support after repeated attempts to hold the trendline. The breakdown followed a rejection near the weekly 20-week Exponential Moving Average (EMA), currently positioned around $1.57.
XRP broke below its multi-month ascending support after failing to reclaim the weekly 20 EMA near $1.57, sending the price toward the $1.00 level. Source: ChartNerd via X
The analyst noted that XRP also remains well below the weekly 50 EMA near $1.83, reinforcing the view that the broader trend remains under pressure.
According to the analysis, the weekly Stochastic RSI has now produced its third bearish death cross since XRP reached its all-time high in July 2025. Previous occurrences were followed by extended corrections, making the current signal one that traders are monitoring closely rather than treating as a guarantee of further downside.
ChartNerdTA also pointed out that XRP has recorded multiple weekly closes beneath the former ascending support while failing to sustain a move above the $1.50 region. Summarizing the current setup, the analyst wrote:
“It doesn’t feel like the right time yet.”
The latest breakdown also contrasts with the analyst’s outlook from May 2026, when the same ascending support had successfully held for more than three months while price consolidated beneath key moving averages. That support has now been decisively lost.
On-Chain Data Identifies $1.06 as the First Major Defense ZoneWhile the technical trend has weakened, on-chain data suggests several areas where buying interest has previously emerged.
On-chain data identifies $1.06 as XRP’s key near-term support, where more than 830 million tokens previously changed hands, making it a critical level for buyers to defend. Source: Ali Martinez via X
Crypto analyst Ali Martinez highlighted $1.06 as the most important near-term support based on Glassnode’s UTXO Realized Price Distribution (URPD) data. More than 830 million XRP previously changed hands around that level, making it a significant historical accumulation zone.
If sellers push below that support, the data identifies additional high-volume clusters near $0.80, $0.62, and $0.51, where approximately 923 million, 1.16 billion, and 1.06 billion XRP were previously accumulated, respectively.
These levels do not guarantee a reversal but represent areas where historical buying activity may attract renewed market interest if the correction continues.
XRP Price Today Shows Oversold Signals, but Trend Remains WeakAt the time of writing, XRP price today stands near $1.05 on Bitstamp, posting a modest intraday gain of around 0.25%.
TradingView’s technical indicators present a mixed picture. Oscillators lean slightly toward stabilization, while trend-following indicators continue to point lower.
XRP was trading at around $1.0460, down 1.01% in the last 24 hours at press time. Source: XRP price via Brave New Coin
The Relative Strength Index (RSI 14) reads 32.41, approaching oversold territory without reaching extreme levels. Stochastic %K stands at 13.84, while the Commodity Channel Index (CCI 20) sits at -127.34, generating a buy signal after the recent decline.
Momentum (10) and Williams %R (-85.73) also suggest that selling pressure may be slowing. However, the MACD (12,26) remains negative at -0.0515, indicating bearish momentum has not yet disappeared.
Overall, oscillators generate four buy signals, six neutral readings, and one sell signal.
Moving Averages Continue to Favor SellersDespite improving momentum readings, the broader technical structure remains bearish.
Nearly every major moving average—from the 10-period averages around $1.08-$1.09 to the 50-, 100-, and 200-period averages between roughly $1.21 and $1.53—continues to issue sell signals. The only notable exception is the Hull Moving Average (9), which currently produces a buy signal near $1.025, while the Ichimoku Base Line remains neutral.
ChartNerdTA highlighted XRP’s third weekly Stoch RSI death cross since the July 2025 peak, with price once again facing resistance at the weekly 20 and 50 EMAs after January 2026’s bearish crossover. Source: @ChartNerdTA via X
In total, moving averages register approximately 13 sell signals, one neutral reading, and one buy signal, illustrating that Ripple XRP price prediction models based on trend-following indicators continue to favor the downside until price reclaims key resistance levels.
TradingView’s overall technical summary remains neutral, combining 14 sell signals, seven neutral readings, and five buy signals.
Pivot points also outline the next technical levels to watch. The classic pivot sits around $1.38, while immediate resistance is located near $1.50. On the downside, S2 is positioned around $1.10 and S3 near $0.81, closely aligning with the historical on-chain support identified around $0.80.
For now, the technical picture suggests that while oversold conditions could allow for a short-term relief bounce, the broader trend remains under pressure. Whether Ripple XRP can defend the $1.06 support zone may determine if the XRP price prediction shifts toward stabilization or if traders begin focusing on the next major demand area near $0.80.
Why this matters
XRP is a tracked market entity in the DigitalMoneyBox archive, making this useful context for readers monitoring repeated mentions and follow-up coverage.
Original source
Read on Brave New CoinRelated market context

Ethereum (ETH) Price Prediction: Whale Rotates $155M Into ETH as Longs Surge Near $2,500
Ethereum is trying to stabilize after another volatile stretch, with price returning toward the mid-$2,400 region while several po...
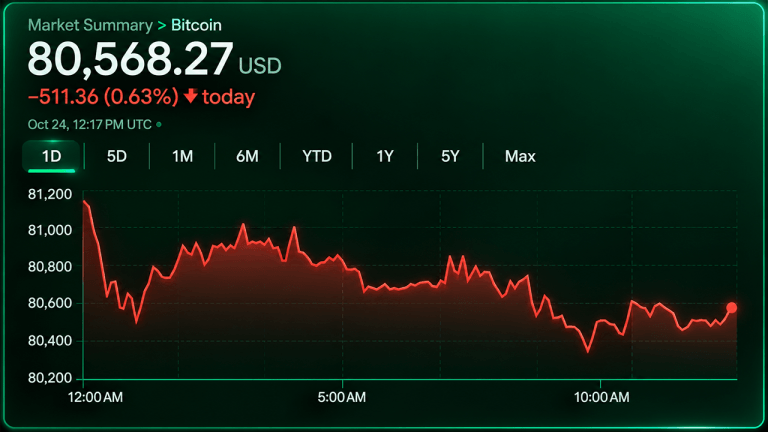
Bitcoin Price Faces $78K Threat as Sellers Hammer Key Support
Bitcoin’s price traded near $80,500 Saturday morning, Oct. 24, with sellers controlling the shorter time frames despite longer-ter...
Dune Adds Real-Time Spot And Perpetual Trade Feeds Across On-Chain Markets
TL;DR: Dune has launched normalized real-time feeds for spot and perpetual DEX trades, designed to help institutional desks compar...

Kalshi and Polymarket hit record $2.7 billion in weekly crypto volume
The surge in crypto prediction market volume highlights a shift towards short-term speculative trading, impacting traditional trad...

Ethereum Glamsterdam Upgrade Delayed Over Smart Contract Security Risks
Ethereum developers have postponed the Glamsterdam upgrade on the Hoodi testnet after researchers identified potential security ri...
Franklin Moves Bitcoin DRIP ETFs Toward Nasdaq With Dividend Reinvestment Plan
TL;DR: Franklin Templeton has filed exchange registrations for two stock-and-Bitcoin ETFs. Their strategy redirects equity dividen...