XRP Price Pushes for Gains, Resistance Keeps the Market Guessing
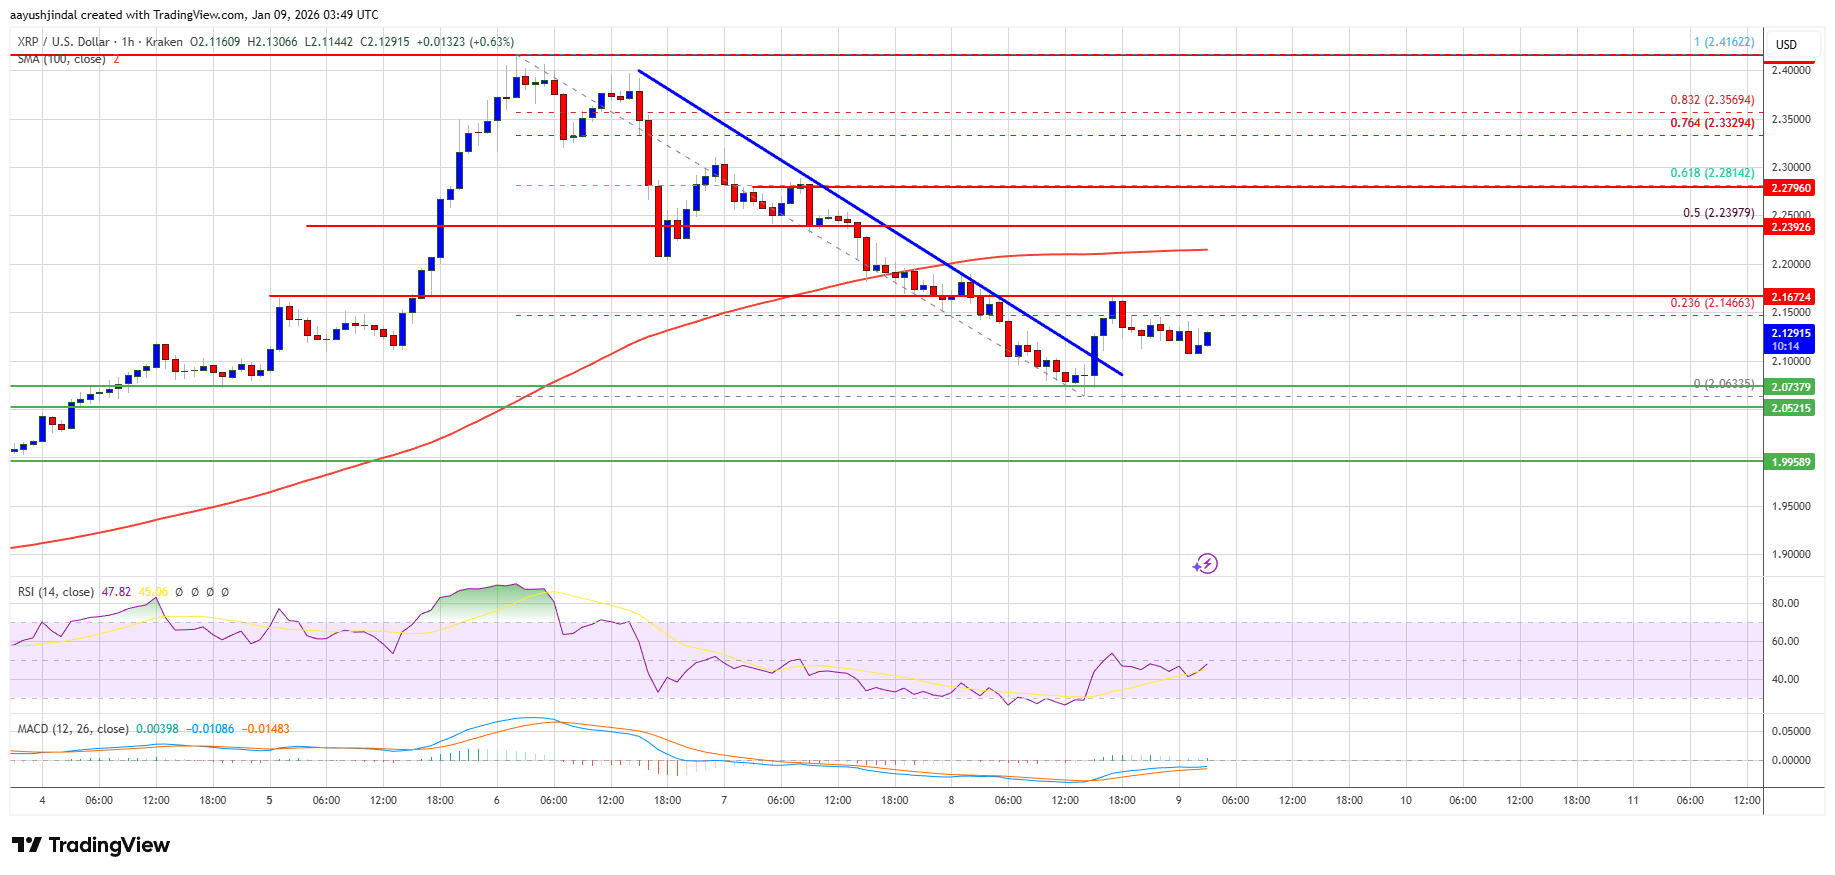
XRP price extended losses and traded below $2.120. The price is now attempting to start a fresh increase and faces hurdles near the $2.20 level. XRP price started a fresh decline below the $2.20 zone. The price is now tr...
Archive context
Older archive item. Useful for background and entity history, but not a fresh market-moving signal.

XRP price extended losses and traded below $2.120. The price is now attempting to start a fresh increase and faces hurdles near the $2.20 level.
- XRP price started a fresh decline below the $2.20 zone.
- The price is now trading below $2.20 and the 100-hourly Simple Moving Average.
- There was a break above a connecting bearish trend line with resistance at $2.10 on the hourly chart of the XRP/USD pair (data source from Kraken).
- The pair could continue to move down if it stays below $2.20.
XRP price failed to stay above $2.25 and started a fresh decline, like Bitcoin and Ethereum. The price declined below $2.20 and $2.150 to enter a short-term bearish zone.
The price even spiked below $2.10. A low was formed at $2.063, and the price is now attempting to recover. There was a move above $2.120. Besides, there was a break above a connecting bearish trend line with resistance at $2.10 on the hourly chart of the XRP/USD pair.
It tested the 23.6% Fib retracement level of the downward move from the $2.416 swing high to the $2.063 low. The price is now trading below $2.20 and the 100-hourly Simple Moving Average.
If there is a fresh upward move, the price might face resistance near the $2.1680 level. The first major resistance is near the $2.20 level. A close above $2.20 could send the price to $2.240 or the 50% Fib retracement level of the downward move from the $2.416 swing high to the $2.063 low.
The next hurdle sits at $2.280. A clear move above the $2.280 resistance might send the price toward the $2.320 resistance. Any more gains might send the price toward the $2.350 resistance. The next major hurdle for the bulls might be near $2.40.
Another Decline?If XRP fails to clear the $2.20 resistance zone, it could start a fresh decline. Initial support on the downside is near the $2.080 level. The next major support is near the $2.050 level.
If there is a downside break and a close below the $2.050 level, the price might continue to decline toward $2.00. The next major support sits near the $1.9650 zone, below which the price could continue lower toward $1.880.
Technical Indicators
Hourly MACD – The MACD for XRP/USD is now losing pace in the bearish zone.
Hourly RSI (Relative Strength Index) – The RSI for XRP/USD is now below the 50 level.
Major Support Levels – $2.080 and $2.050.
Major Resistance Levels – $2.1680 and $2.240.
Why this matters
XRP is a tracked market entity in the DigitalMoneyBox archive, making this useful context for readers monitoring repeated mentions and follow-up coverage.
Original source
Read on NewsBTCRelated market context

Ethereum Price Eyes $2,000 as AI Funds Shift From Chips to ETH, Says Tom Lee
Ethereum is pressing against a price level that has capped every rally. ETH trades at $1,925, little changed over the past 24 hour...

Worldcoin (WLD) Price Prediction: Can Grayscale’s Worldcoin ETF Filing Trigger a WLD Rebound Above $0.45?
The filing has put the token back in focus at a time when WLD remains well below its recent 2026 highs and technical indicators co...

Ethereum News: Builder Activity & Leverage Data Align, $2k Next?
In Ethereum news today, new smart contract deployments on the network have surged 192% above the 90-day baseline, with funding rat...

XRP Price Prediction: XRP Holds Above $1.14 as Bulls Battle to Reverse the Broader Downtrend
The move has improved the short-term technical picture, but the broader trend remains under pressure as XRP continues to trade bel...
XRP Price Could Turn Volatile This Month: What’s at Stake for Ripple?
XRP price is trading around $1.13, up about 2% over the past 24 hours. Those modest gains hide a much larger binary risk approachi...

Ethereum Security Team Turns To AI Agents For Vulnerability Triage
The Ethereum Foundation’s Protocol Security team is using coordinated AI agents to help scan protocol repositories and devnets for...