XRP Price Ready for Bullish Spike: Fading Bearish Momentum and Solid Support
XRP price extended losses and tested the $0.4440 support zone. The price is correcting losses sharply and might soon retest the $0.4720 resistance. XRP price is correcting losses from the $0.4440 support zone. The price...

XRP price extended losses and tested the $0.4440 support zone. The price is correcting losses sharply and might soon retest the $0.4720 resistance.
- XRP price is correcting losses from the $0.4440 support zone.
- The price is now trading below $0.4650 and the 100-hourly Simple Moving Average.
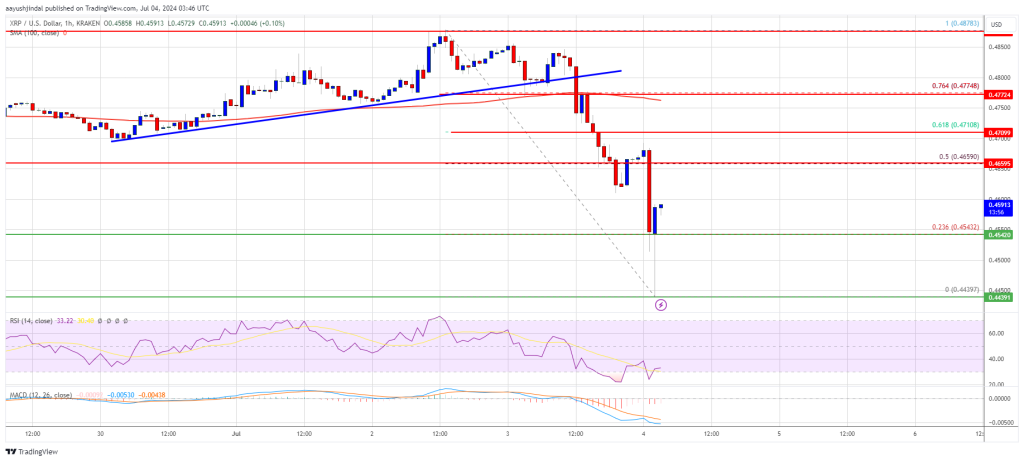
- There was a break below a key bullish trend line with support at $0.480 on the hourly chart of the XRP/USD pair (data source from Kraken).
- The pair might climb higher again if it stays above the $0.450 support zone.
XRP price struggled to clear the $0.4850 resistance and started a fresh decline, like Bitcoin and Ethereum. The bears took control and pushed the price below the $0.470 support. There was a break below a key bullish trend line with support at $0.480 on the hourly chart of the XRP/USD pair.
The pair even declined heavily below the $0.4550 support level. However, the bulls protected the $0.4440 support level. A low was formed at $0.4439 and the price is now correcting losses. There was a recovery wave above the $0.4520 resistance.
The price climbed above the 23.6% Fib retracement level of the recent decline from the $0.4878 swing high to the $0.4439 low. It is now trading below $0.4650 and the 100-hourly Simple Moving Average.
On the upside, the price is facing resistance near the $0.4620 level. The first major resistance is near the $0.4650 level and the 50% Fib retracement level of the recent decline from the $0.4878 swing high to the $0.4439 low. The next key resistance could be $0.4720.
A clear move above the $0.4720 resistance might send the price toward the $0.4850 resistance. The next major resistance is near the $0.500 level. Any more gains might send the price toward the $0.5250 resistance.
Another Decline?If XRP fails to clear the $0.4650 resistance zone, it could start another decline. Initial support on the downside is near the $0.4520 level.
The next major support is at $0.4440. If there is a downside break and a close below the $0.4440 level, the price might continue to decline toward the $0.4320 support in the near term.
Technical Indicators
Hourly MACD – The MACD for XRP/USD is now losing pace in the bearish zone.
Hourly RSI (Relative Strength Index) – The RSI for XRP/USD is now below the 50 level.
Major Support Levels – $0.4520 and $0.4440.
Major Resistance Levels – $0.4620 and $0.4650.
Original source
Read on NewsBTCRelated market context

Standard Chartered Says Bitcoin Bottomed Near $59,000 As Crypto Winter Ends
TL;DR Standard Chartered’s Geoffrey Kendrick reportedly says Bitcoin’s $59,000 area marked the cycle bottom. The note cites SpaceX...

US forces shoot down Iranian attack drones near Strait of Hormuz, Bitcoin drops below $73K
Geopolitical tensions near vital oil routes can destabilize financial markets, highlighting the interconnectedness of global secur...

Bitcoin Mining Cost Model Points To $47,000 Floor, But Analysts Urge Caution
TL;DR Crypto Rover says Bitcoin has never bottomed below electrical production cost, currently estimated at $47,000. Mining-cost m...

Bitcoin price faces new risk as big buyers lose conviction
Bitcoin’s largest buyers are no longer behaving like a reliable backstop for the largest cryptocurrency. The exchange-traded funds...

XRP aims for $0.90 as ETF demand battles selling pressure from whales
XRP is trading at $1.11, down roughly 17% from its June opening, having set a new 2026 low on June 5 and shed $8 billion in market...

XRP Price Prediction: Japan XRP ETF Listing is Getting Closer
Japan just handed XRP bulls a major regulatory tailwind. XRP price is retesting a congestion zone, and the prediction could turn b...