XRP Price Recovers Slightly, Can Buyers Push Past Obstacles?
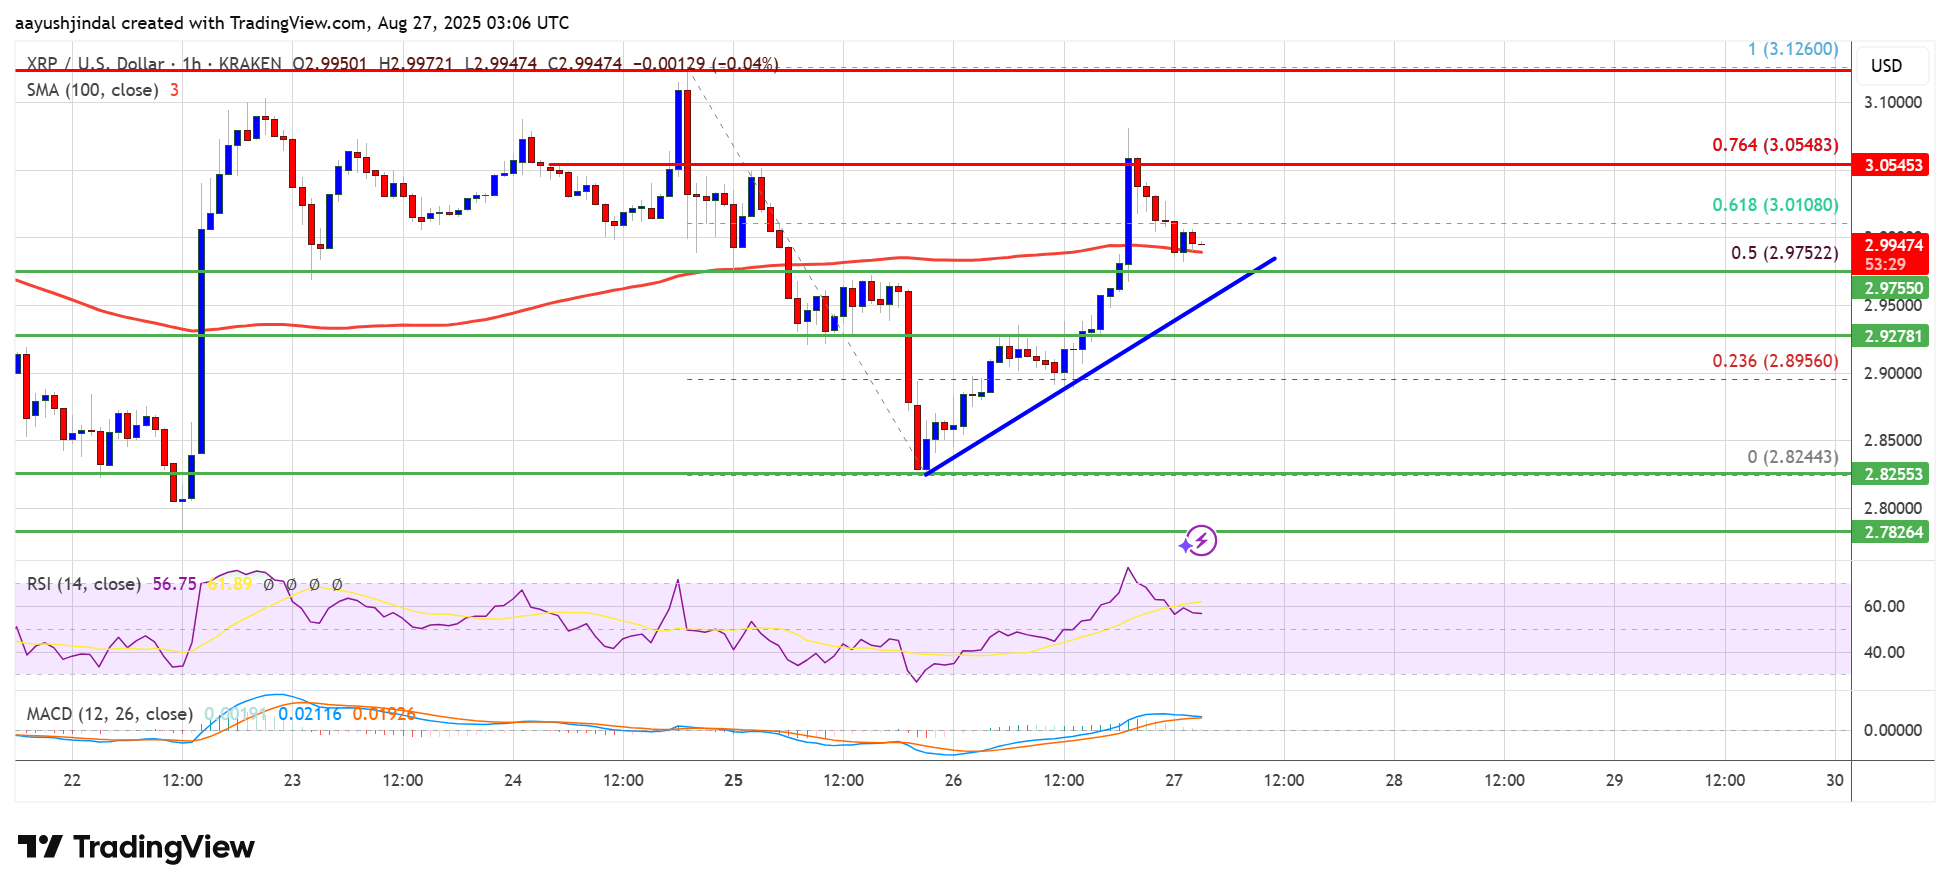
XRP price is correcting losses from the $2.820 zone. The price is now trading below $3.050 and remains at risk of more losses in the near term. XRP price is showing bearish signs below the $3.10 resistance. The price is...
Archive context
Older archive item. Useful for background and entity history, but not a fresh market-moving signal.

XRP price is correcting losses from the $2.820 zone. The price is now trading below $3.050 and remains at risk of more losses in the near term.
- XRP price is showing bearish signs below the $3.10 resistance.
- The price is now trading near $3.00 and the 100-hourly Simple Moving Average.
- There is a bullish trend line forming with support at $2.970 on the hourly chart of the XRP/USD pair (data source from Kraken).
- The pair could continue to decline if it stays below the $3.050 zone.
XRP price started a downside correction below $3.050, like Bitcoin and Ethereum. The price traded below the $3.00 and $2.95 levels before the bulls appeared.
A low was formed at $2.824 and the price is now attempting a fresh increase. There was a move above the $2.92 and $2.95 levels. The price surpassed the 50% Fib retracement level of the downward move from the $3.126 swing high to the $2.824 low.
The price is now trading near $3.00 and the 100-hourly Simple Moving Average. There is also a bullish trend line forming with support at $2.970 on the hourly chart of the XRP/USD pair.
On the upside, the price might face resistance near the $3.050 level and the 76.4% Fib retracement level of the downward move from the $3.126 swing high to the $2.824 low. The first major resistance is near the $3.10 level. A clear move above the $3.10 resistance might send the price toward the $3.120 resistance. Any more gains might send the price toward the $3.150 resistance. The next major hurdle for the bulls might be near $3.20.
Another Decline?If XRP fails to clear the $3.050 resistance zone, it could start a fresh decline. Initial support on the downside is near the $2.970 level. The next major support is near the $2.920 level.
If there is a downside break and a close below the $2.920 level, the price might continue to decline toward $2.840. The next major support sits near the $2.780 zone, below which the price could gain bearish momentum.
Technical Indicators
Hourly MACD – The MACD for XRP/USD is now losing pace in the bearish zone.
Hourly RSI (Relative Strength Index) – The RSI for XRP/USD is now above the 50 level.
Major Support Levels – $2.970 and $2.840.
Major Resistance Levels – $3.050 and $3.10.
Why this matters
This altcoin story adds another data point to the current market tape and is useful when read alongside nearby source coverage.
Original source
Read on NewsBTCRelated market context

XRP Price Prediction: XRP Faces Critical Resistance Near $1.17 Despite Ripple Securing Landmark EU License
While the company secured a full MiCA license that expands its operations across the European Economic Area, market indicators sug...

Sam Altman ChatGPT AI Predicts Insane Bitcoin Price by 2026
Sam Altman ChatGPT AI just circled November on the calendar and put a number next to Bitcoin Price Prediction. The model predicts...

Elon Musk Grok AI Predicts Incredible XRP Price Target by End of 2026
Elon Musk Grok AI just published what might be the most partnership-heavy XRP price prediction in this entire series. The model pr...

Iran shoots down US MQ-9 Reaper drone, Bitcoin drops below $73K as nearly $1B in crypto liquidations follow
Geopolitical tensions highlight crypto market volatility, underscoring the interconnectedness with traditional finance and potenti...

IPO volume hits levels last seen in 1929 and 2000, and crypto markets are building the on-ramp
The surge in IPOs and crypto's role in facilitating access could signal heightened market volatility and regulatory challenges ahe...

Bitcoin price rebounds to $63K as leverage returns creating short term volatility risk
Bitcoin's rebound has cleared the first test: price recovered. The harder one starts now: proving buyers remain after the squeeze....