XRP Price Recovery Stalls Near Resistance, Bears Eye Renewed Downside
XRP price started a recovery wave above $1.380 but failed near $1.3980. The price is now consolidating and might aim for a fresh move above $1.40. XRP price started a recovery wave above the $1.3750 zone. The price is no...

XRP price started a recovery wave above $1.380 but failed near $1.3980. The price is now consolidating and might aim for a fresh move above $1.40.
- XRP price started a recovery wave above the $1.3750 zone.
- The price is now trading below $1.40 and the 100-hourly Simple Moving Average.
- There is a bearish trend line forming with resistance at $1.4100 on the hourly chart of the XRP/USD pair (data source from Kraken).
- The pair could continue to move up if it settles above $1.40.
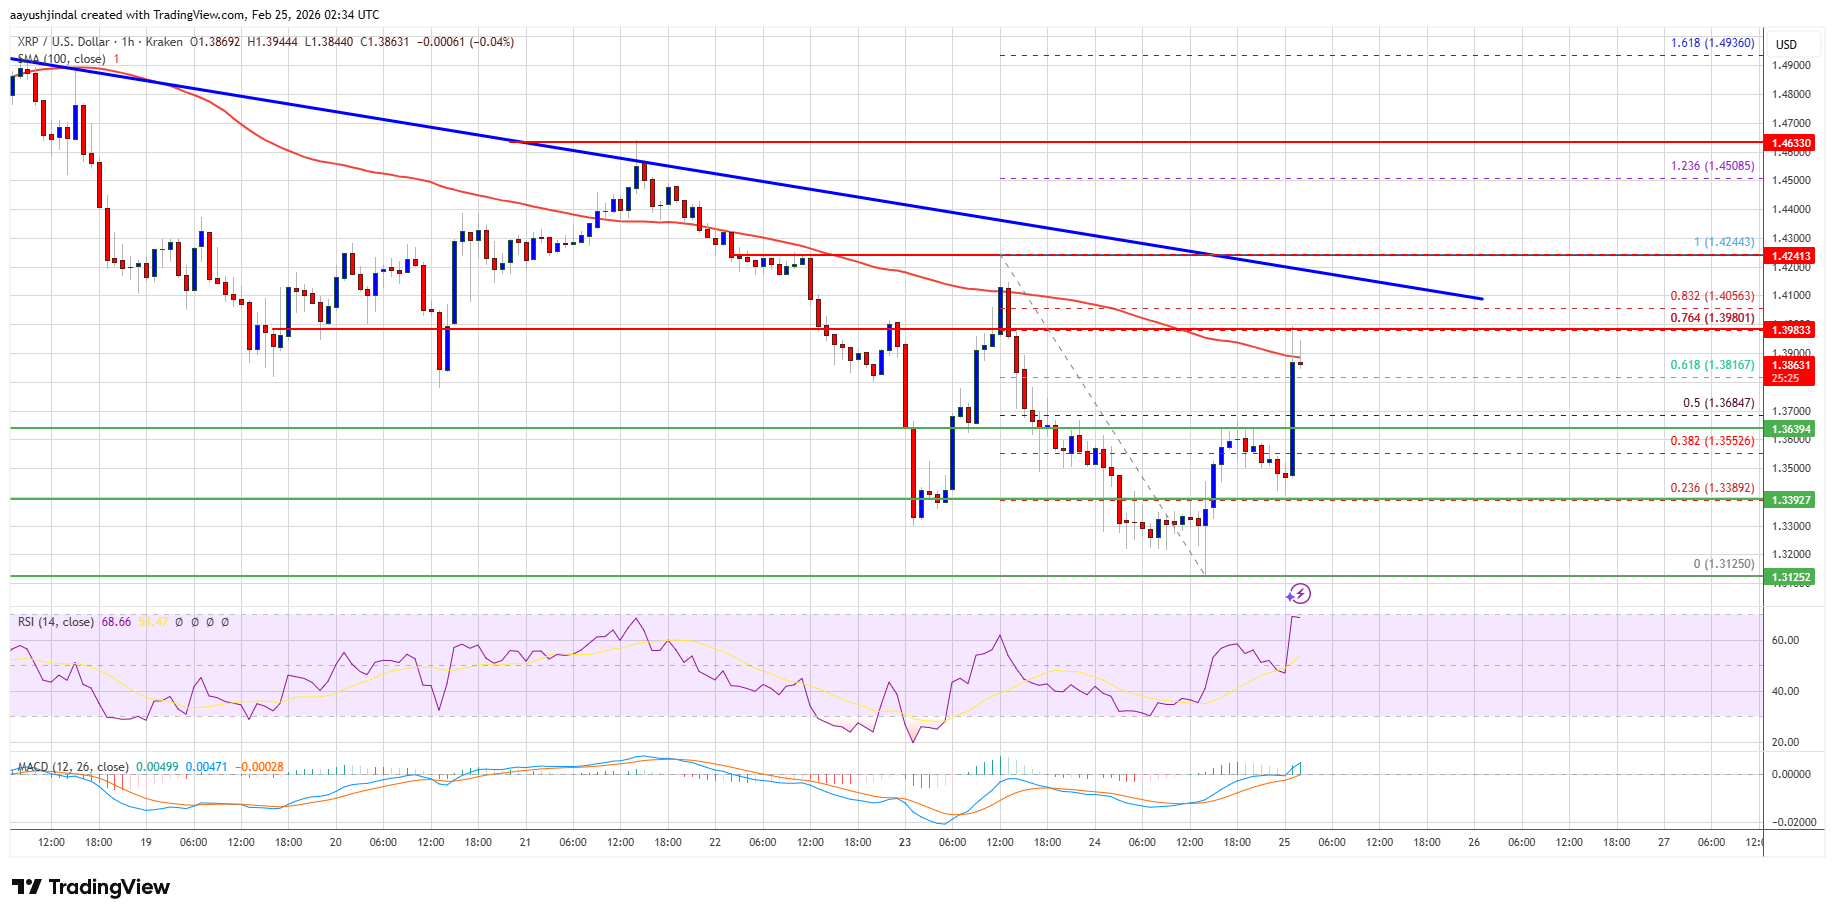
XRP price remained supported above $1.3120 and started a recovery wave, like Bitcoin and Ethereum. The price was able to climb above $1.3350 and $1.350 to enter a short-term positive zone.
There was also a move above the 50% Fib retracement level of the downward move from the $1.4244 swing high to the $1.3125 low. The bulls even pushed the price above $1.38 but they struggled to keep the price above $1.3950. Besides, there is a bearish trend line forming with resistance at $1.410 on the hourly chart of the XRP/USD pair.
The price is now trading below $1.40 and the 100-hourly Simple Moving Average. If there is a fresh upward move, the price might face resistance near the $1.3980 level or the 76.4% Fib retracement level of the downward move from the $1.4244 swing high to the $1.3125 low.
The first major resistance is near the $1.4050 level. A close above $1.4050 could send the price to $1.4120. The next hurdle sits at $1.4250. A clear move above the $1.4250 resistance might send the price toward the $1.450 resistance. Any more gains might send the price toward the $1.50 resistance.
Another Drop?If XRP fails to clear the $1.40 resistance zone, it could start a fresh decline. Initial support on the downside is near the $1.3650 level. The next major support is near the $1.350 level.
If there is a downside break and a close below the $1.350 level, the price might continue to decline toward $1.3320. The next major support sits near the $1.3220 zone, below which the price could continue lower toward $1.3120.
Technical Indicators
Hourly MACD – The MACD for XRP/USD is now gaining pace in the bullish zone.
Hourly RSI (Relative Strength Index) – The RSI for XRP/USD is now above the 50 level.
Major Support Levels – $1.3650 and $1.3500.
Major Resistance Levels – $1.4000 and $1.4120.
Original source
Read on NewsBTCRelated market context

Ethereum Price Prediction: 3 Million ETH Rushes Into Staking as Sellers Vanish
Is nobody leaving Ethereum? A record 36 million ETH is now locked in staking, roughly 29–30% of the circulating supply, and the va...

Most Traders Will Scroll Past This Grok AI Bitcoin Predicts, Big Mistake
Elon Musk Grok AI just looked at a Bitcoin chart down more than 50% and predicts it’s a classic accumulation zone, targeting $150,...

XRP Price Prediction: Japan Regulates Crypto like Stocks, XRP to Benefit First
Japan just rewrote the rules. XRP price is battling below resistance at $1.10, but it’s prediction is getting bullish as Japan’s p...

XRP Price Prediction: Japan XRP ETF Listing is Getting Closer
Japan just handed XRP bulls a major regulatory tailwind. XRP price is retesting a congestion zone, and the prediction could turn b...

The 3-Part Impulse That Shows Where The XRP Price Is Headed Next
XRP bulls are trying to turn a brutal selloff into something bigger than a relief bounce. An interesting setup shows a possible th...

Bitcoin price faces new risk as big buyers lose conviction
Bitcoin’s largest buyers are no longer behaving like a reliable backstop for the largest cryptocurrency. The exchange-traded funds...