XRP Price Retraces Gains But Maintains Its Bullish Structure
XRP price found support at $2.250 and started a fresh increase. The price is now correcting gains from $2.650 and testing the $2.420 support zone. XRP price started a fresh increase above the $2.50 zone. The price is now...
Archive context
Older archive item. Useful for background and entity history, but not a fresh market-moving signal.

XRP price found support at $2.250 and started a fresh increase. The price is now correcting gains from $2.650 and testing the $2.420 support zone.
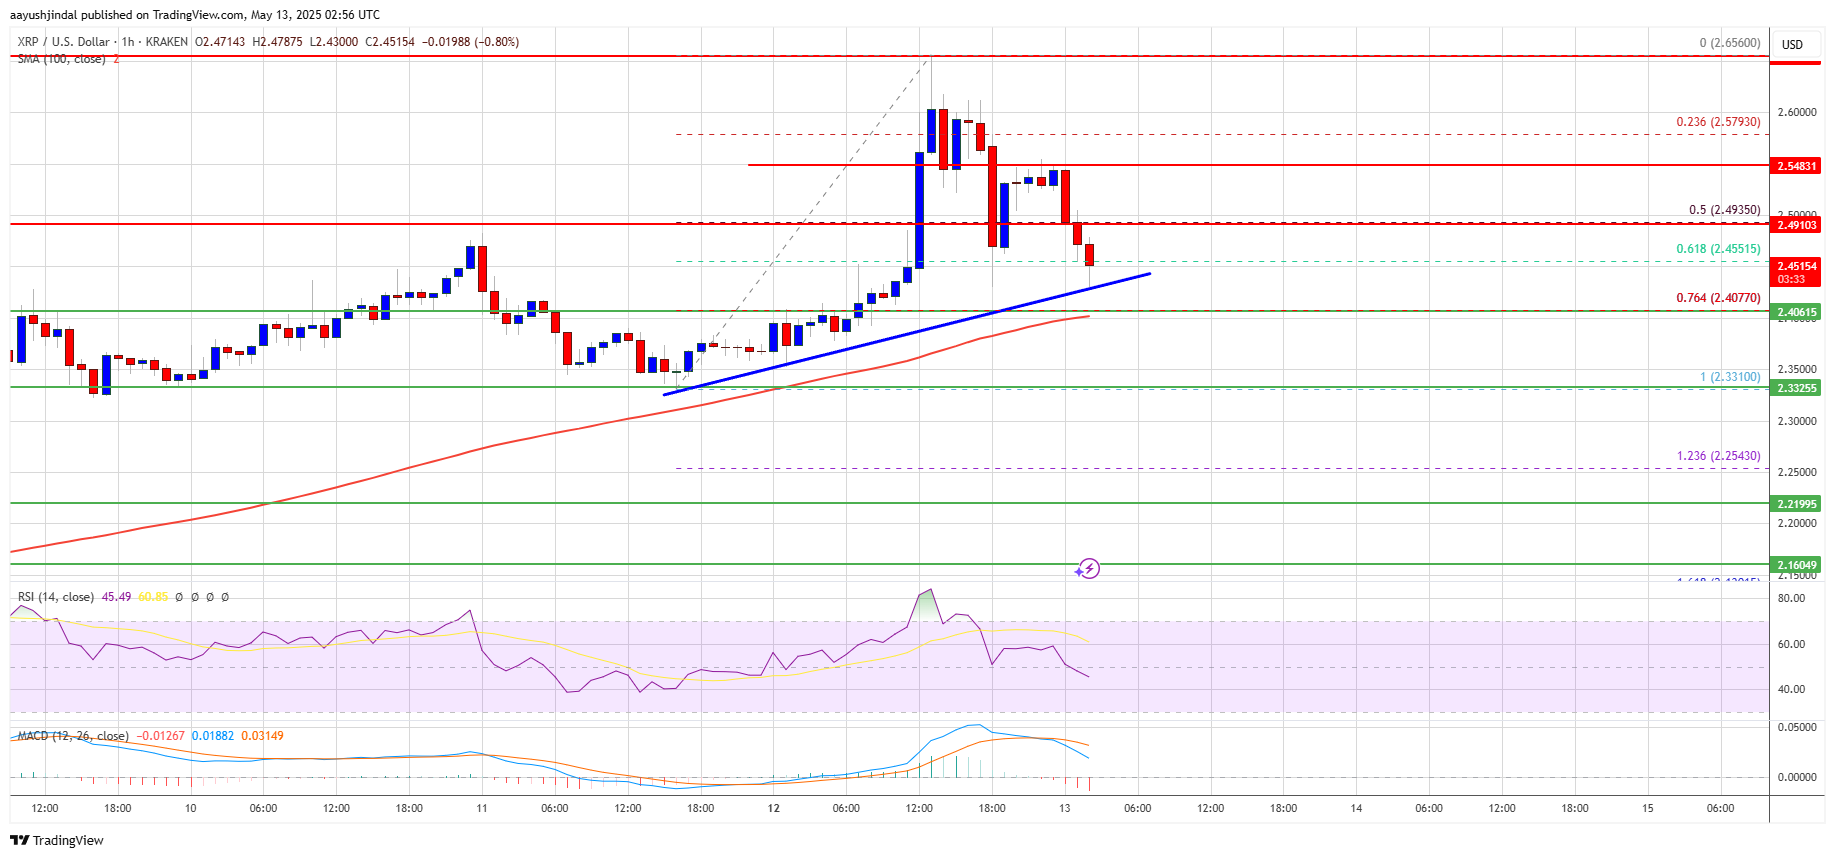
- XRP price started a fresh increase above the $2.50 zone.
- The price is now trading above $2.40 and the 100-hourly Simple Moving Average.
- There is a key bullish trend line forming with support at $2.4350 on the hourly chart of the XRP/USD pair (data source from Kraken).
- The pair might start another increase if there is a close above the $2.550 resistance.
XRP price remained supported above the $2.250 level and started a fresh upward wave, like Bitcoin and Ethereum. The price was able to surpass the $2.350 and $2.40 levels.
The bulls pushed the price above the $2.50 resistance zone to set the pace for more gains. Finally, it tested the $2.650 zone. A high was formed at $2.6560 before there was a pullback. The price dipped below $2.50 and the 50% Fib retracement level of the upward move from the $2.3310 swing low to the $2.6560 high.
However, the bulls are active above $2.40. The price is now trading above $2.420 and the 100-hourly Simple Moving Average. There is also a key bullish trend line forming with support at $2.4350 on the hourly chart of the XRP/USD pair.
On the upside, the price might face resistance near the $2.4950 level. The first major resistance is near the $2.550 level. The next resistance is $2.600. A clear move above the $2.60 resistance might send the price toward the $2.650 resistance. Any more gains might send the price toward the $2.720 resistance or even $2.7450 in the near term. The next major hurdle for the bulls might be $2.80.
Another Decline?If XRP fails to clear the $2.550 resistance zone, it could start another decline. Initial support on the downside is near the $2.4350 level and the trend line. The next major support is near the $2.40 level.
If there is a downside break and a close below the $2.40 level, the price might continue to decline toward the $2.350 support. The next major support sits near the $2.320 zone.
Technical Indicators
Hourly MACD – The MACD for XRP/USD is now losing pace in the bullish zone.
Hourly RSI (Relative Strength Index) – The RSI for XRP/USD is now below the 50 level.
Major Support Levels – $2.4350 and $2.40.
Major Resistance Levels – $2.50 and $2.550.
Why this matters
This altcoin story adds another data point to the current market tape and is useful when read alongside nearby source coverage.
Original source
Read on NewsBTCRelated market context

Leading Claude AI Fable 5 Predicts Stunning XRP Price by The End of 2026
Anthropic’s new Claude AI model, Fable 5, predicts XRP price for the entire second half around a single event that could be resolv...

JP Morgan Warns of New Bitcoin Sell Pressure From Strategy While XRP AI Transactions Approach 1 Million
Although the two developments are unrelated, they illustrate how Bitcoin’s institutional investment narrative and XRP’s expanding...

XRP vs Bitcoin: Investor Says RLUSD Growth and Regulatory Clarity Could Shift Crypto’s Balance of Power
While the claim remains highly ambitious given Bitcoin’s commanding lead in market capitalization, the discussion highlights broad...

XRP Price Prediction: SuperTrend Buy Signal Meets Shrinking Supply as $1.24 Breakout Comes Into Focus
After a fresh SuperTrend buy signal appeared on the 4-hour chart, analysts are watching whether the XRP price can extend its recen...

Mark Zuckerberg’s Meta AI Predicts Unbelievable Bitcoin Price by the End of 2026
Mark Zuckerberg’s Meta AI predicts and stacks 4 numbered catalysts behind its Bitcoin price prediction that puts $120,000 to $150,...

Vitalik’s Lean Ethereum Plan Targets 10x Lower Fees, Quantum Safety, and Faster Finality
Key Takeaways: Vitalik Buterin announced the multi-year “Lean Ethereum” roadmap and declared it a third generation update for Ethe...