XRP Price Shows Some Weakness – Is a Deeper Pullback on the Cards?
XRP price started a downside correction below the $3.250 zone. The price is now consolidating and might dip further below the $3.050 zone. XRP price started a fresh pullback below the $3.250 zone. The price is now tradin...
Archive context
Older archive item. Useful for background and entity history, but not a fresh market-moving signal.
XRP price started a downside correction below the $3.250 zone. The price is now consolidating and might dip further below the $3.050 zone.
- XRP price started a fresh pullback below the $3.250 zone.
- The price is now trading below $3.220 and the 100-hourly Simple Moving Average.
- There was a break below a key bullish trend line with support at $3.240 on the hourly chart of the XRP/USD pair (data source from Kraken).
- The pair could start another increase if it stays above the $3.080 zone.
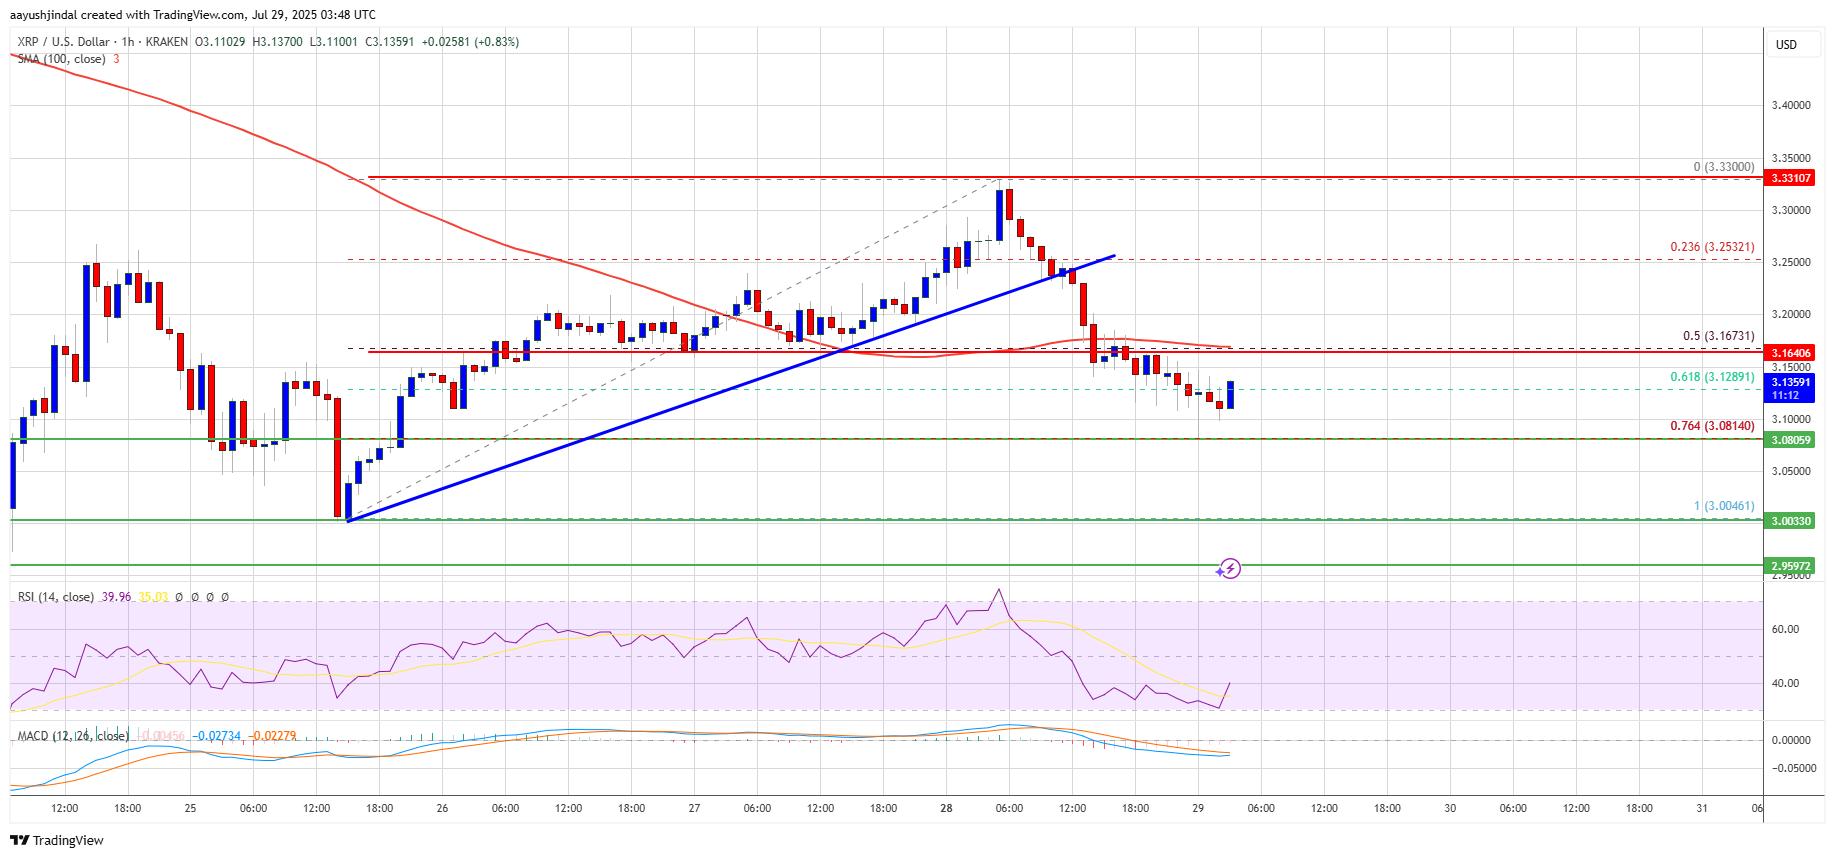
XRP price started a fresh decline from the $3.330 zone, like Bitcoin and Ethereum. The price declined below the $3.2850 and $3.250 support levels.
The price dipped below the 50% Fib retracement level of the upward move from the $3.004 swing low to the $3.330 high. Besides, there was a break below a key bullish trend line with support at $3.240 on the hourly chart of the XRP/USD pair.
The decline was such that the price traded below the $3.120 level. The price is now trading below $3.150 and the 100-hourly Simple Moving Average.
On the upside, the price might face resistance near the $3.1680 level. The first major resistance is near the $3.220 level. A clear move above the $3.220 resistance might send the price toward the $3.250 resistance. Any more gains might send the price toward the $3.330 resistance or even $3.350 in the near term. The next major hurdle for the bulls might be near the $3.40 zone.
Another Drop?If XRP fails to clear the $3.250 resistance zone, it could start another decline. Initial support on the downside is near the $3.080 level or the 76.4% Fib retracement level of the upward move from the $3.004 swing low to the $3.330 high. The next major support is near the $3.050 level.
If there is a downside break and a close below the $3.050 level, the price might continue to decline toward the $3.020 support. The next major support sits near the $3.00 zone where the bulls might take a stand.
Technical Indicators
Hourly MACD – The MACD for XRP/USD is now gaining pace in the bearish zone.
Hourly RSI (Relative Strength Index) – The RSI for XRP/USD is now below the 50 level.
Major Support Levels – $3.080 and $3.00.
Major Resistance Levels – $3.1680 and $3.250.
Why this matters
This altcoin story adds another data point to the current market tape and is useful when read alongside nearby source coverage.
Original source
Read on NewsBTCRelated market context

XRP Price Prediction: XRP Faces Critical Resistance Near $1.17 Despite Ripple Securing Landmark EU License
While the company secured a full MiCA license that expands its operations across the European Economic Area, market indicators sug...

Bitcoin (BTC) Price Prediction: BTC Holds $63K Support—Can Rising Active Addresses Offset Bearish Technical Signals?
Although the BTC price has remained near a key support zone, recent chart signals and Strategy’s sale of a portion of its Bitcoin...

Bitcoin price rebounds to $63K as leverage returns creating short term volatility risk
Bitcoin's rebound has cleared the first test: price recovered. The harder one starts now: proving buyers remain after the squeeze....
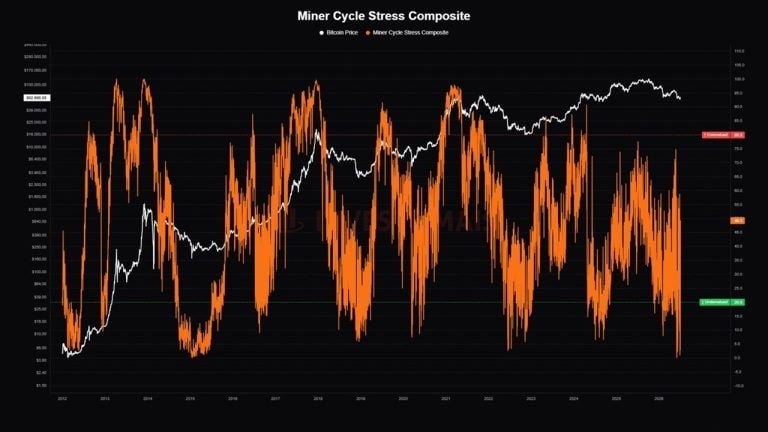
Bitcoin Miner Stress Hits ‘Historically Rare’ Level as 20% of Miners Operate at a Loss
Bitcoin’s Miner Cycle Stress Composite has fallen to a new 2026 low and entered its “undervalued” range, a synchronized decline pr...

Bitcoin miner bottom signal now depends on who survives weak mining profits
A Bitcoin miner-stress signal circulating on X has fallen into a zone analysts associate with severe miner pressure, putting a fam...

Strategy dumps 3,500 BTC in largest sale… yet
Michael Saylor’s Strategy (formerly MicroStrategy) has sold 3,588 BTC for $216 million. His average sale price was approximately $...