XRP Price Slips Toward $2.00, Increasing Pressure on Short-Term Support Levels
XRP price started a fresh decline from $2.250. The price is now showing bearish signs and might extend losses if it dips below $2.120. XRP price started a fresh decline below the $2.250 zone. The price is now trading bel...

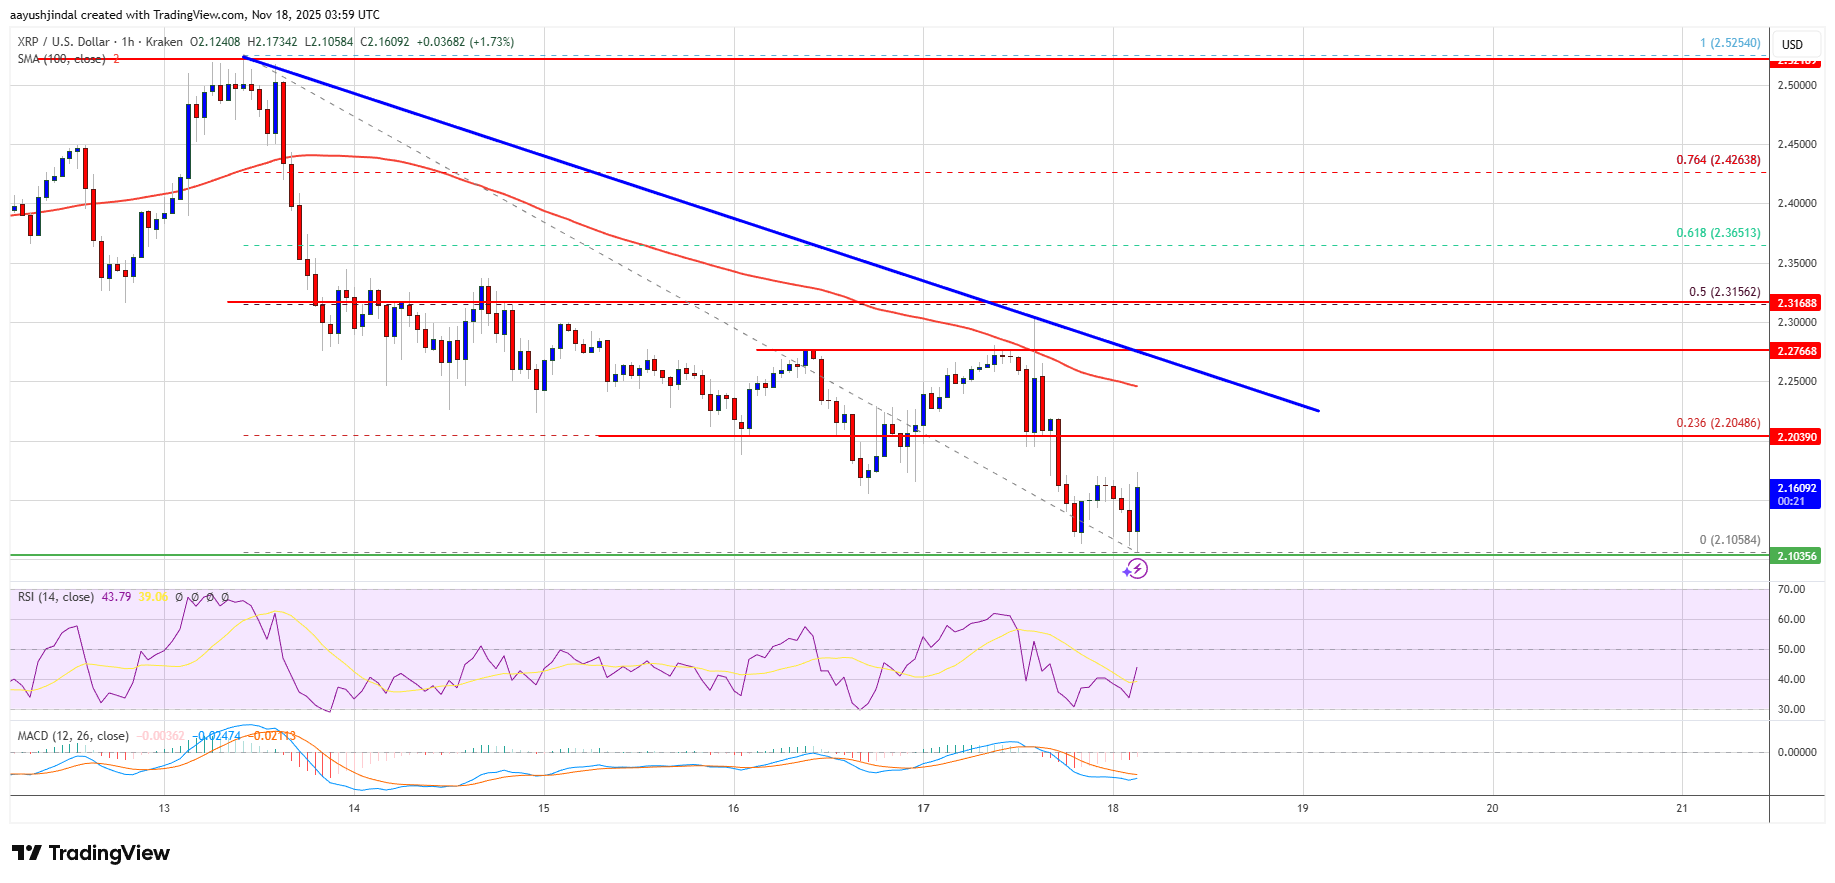
XRP price started a fresh decline from $2.250. The price is now showing bearish signs and might extend losses if it dips below $2.120.
- XRP price started a fresh decline below the $2.250 zone.
- The price is now trading below $2.20 and the 100-hourly Simple Moving Average.
- There is a bearish trend line forming with resistance at $2.220 on the hourly chart of the XRP/USD pair (data source from Kraken).
- The pair could continue to move down if it settles below $2.120.
XRP price attempted a recovery wave above $2.30 but failed to continue higher, like Bitcoin and Ethereum. The price started a fresh decline below $2.250 and $2.20.
There was a move below the $2.150 support level. A low was formed at $2.105, and the price is now consolidating losses with a bearish angle below the 23.6% Fib retracement level of the downward move from the $2.525 swing high to the $2.058 low.
The price is now trading below $2.20 and the 100-hourly Simple Moving Average. If there is a fresh upward move, the price might face resistance near the $2.20 level. The first major resistance is near the $2.220 level. There is also a bearish trend line forming with resistance at $2.220 on the hourly chart of the XRP/USD pair.
A close above the trend line could send the price to $2.28. The next hurdle sits at $2.320 or the 50% Fib retracement level of the downward move from the $2.525 swing high to the $2.058 low. A clear move above the $2.320 resistance might send the price toward the $2.40 resistance. Any more gains might send the price toward the $2.450 resistance. The next major hurdle for the bulls might be near $2.50.
Another Drop?If XRP fails to clear the $2.220 resistance zone, it could start a fresh decline. Initial support on the downside is near the $2.120 level. The next major support is near the $2.10 level.
If there is a downside break and a close below the $2.10 level, the price might continue to decline toward $2.050. The next major support sits near the $2.020 zone, below which the price could continue lower toward $1.880.
Technical Indicators
Hourly MACD – The MACD for XRP/USD is now gaining pace in the bearish zone.
Hourly RSI (Relative Strength Index) – The RSI for XRP/USD is now below the 50 level.
Major Support Levels – $2.120 and $2.050.
Major Resistance Levels – $2.20 and $2.220.
Original source
Read on NewsBTCRelated market context

The 3-Part Impulse That Shows Where The XRP Price Is Headed Next
XRP bulls are trying to turn a brutal selloff into something bigger than a relief bounce. An interesting setup shows a possible th...

Most Traders Will Scroll Past This Grok AI Bitcoin Predicts, Big Mistake
Elon Musk Grok AI just looked at a Bitcoin chart down more than 50% and predicts it’s a classic accumulation zone, targeting $150,...

XRP Price Prediction: Japan Regulates Crypto like Stocks, XRP to Benefit First
Japan just rewrote the rules. XRP price is battling below resistance at $1.10, but it’s prediction is getting bullish as Japan’s p...

Bitcoin price faces new risk as big buyers lose conviction
Bitcoin’s largest buyers are no longer behaving like a reliable backstop for the largest cryptocurrency. The exchange-traded funds...

XRP aims for $0.90 as ETF demand battles selling pressure from whales
XRP is trading at $1.11, down roughly 17% from its June opening, having set a new 2026 low on June 5 and shed $8 billion in market...

Ripple chases AI’s machine economy as XRPL stablecoins near $1 billion
Stablecoin liquidity on the XRP Ledger (XRPL) has nearly doubled over the past month, putting the network within reach of a $1 bil...