XRP Price Stuck Under $2.00 As Markets Brace For Another Slide
XRP price failed to surpass $2.00 and started another decline. The price is now correcting gains and might struggle to stay above $1.860. XRP price started a downside correction and tested the $1.90 zone. The price is no...
Archive context
Older archive item. Useful for background and entity history, but not a fresh market-moving signal.

XRP price failed to surpass $2.00 and started another decline. The price is now correcting gains and might struggle to stay above $1.860.
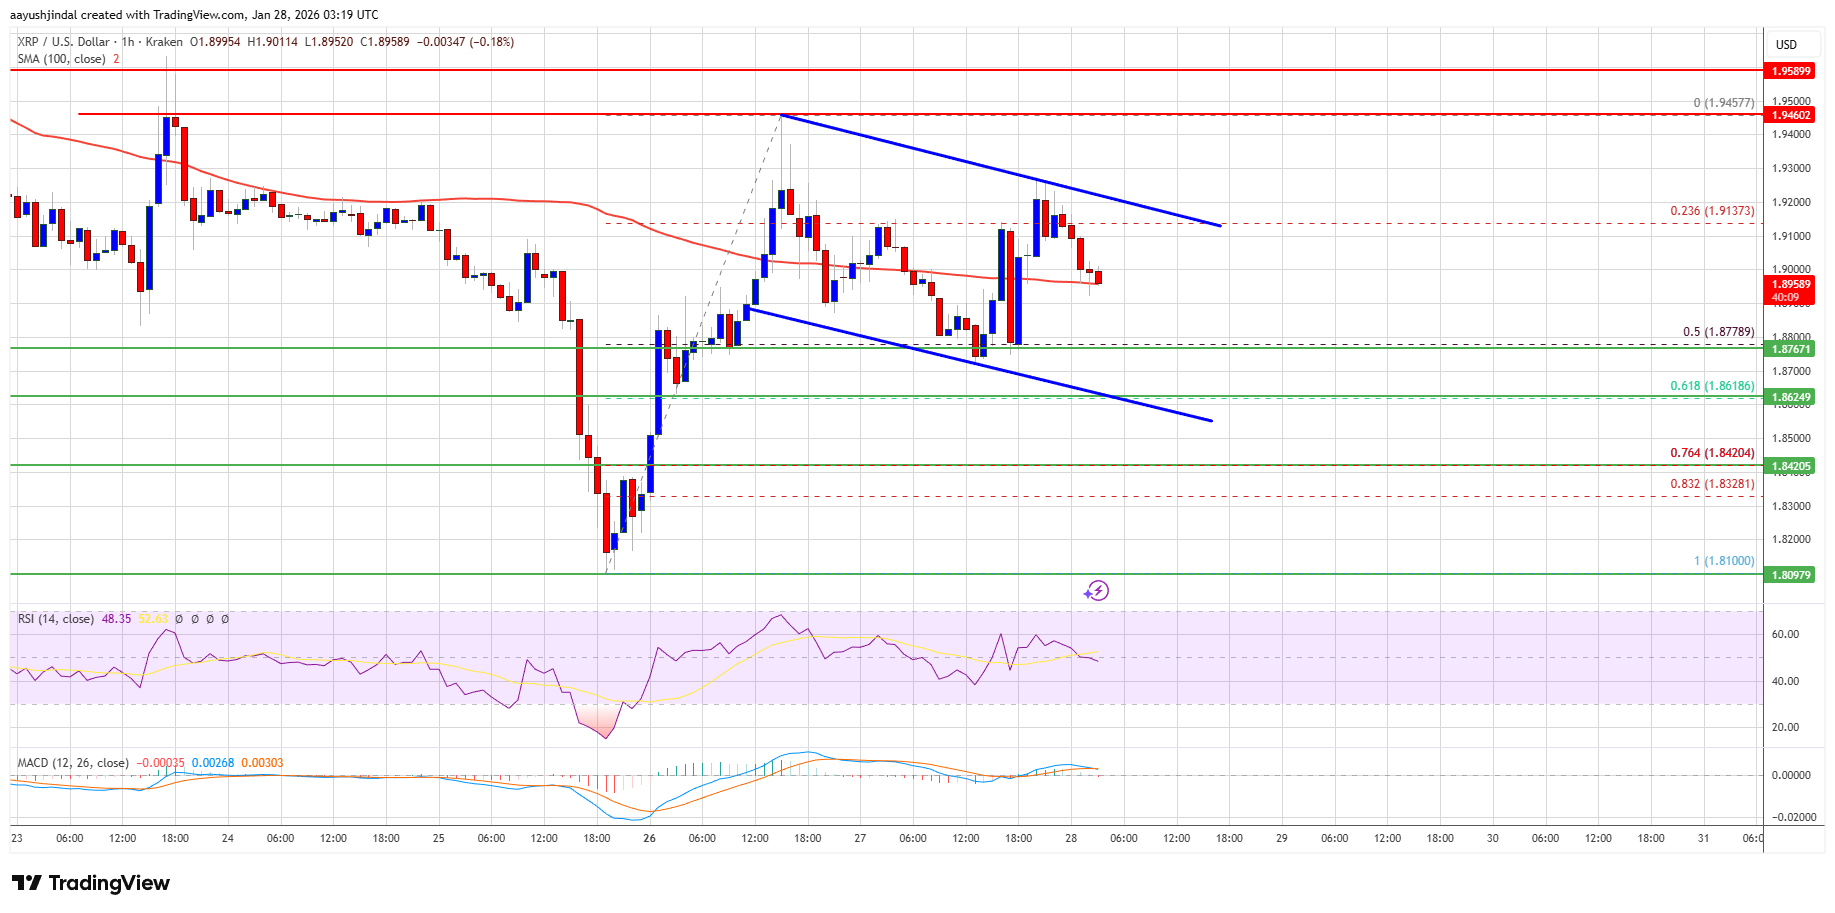
- XRP price started a downside correction and tested the $1.90 zone.
- The price is now trading near $1.890 and the 100-hourly Simple Moving Average.
- There is a declining channel or a possible bullish flag pattern forming with support at $1.860 on the hourly chart of the XRP/USD pair (data source from Kraken).
- The pair could start another increase if it clears $1.950.
XRP price failed to clear $2.00 and started a downside correction, underperforming Bitcoin and Ethereum. The price dipped below the $1.920 and $1.90 levels to enter a negative zone.
The price even dipped below the 50% Fib retracement level of the upward move from the $1.810 swing low to the $1.945 high. The bulls are now active near $1.880. There is also a declining channel or a possible bullish flag pattern forming with support at $1.860 on the hourly chart of the XRP/USD pair.
The price is now trading near $1.890 and the 100-hourly Simple Moving Average. If there is a fresh upward move, the price might face resistance near the $1.920 level. The first major resistance is near the $1.950 level, above which the price could rise and test $2.00.
A clear move above the $2.00 resistance might send the price toward the $2.050 resistance. Any more gains might send the price toward the $2.120 resistance. The next major hurdle for the bulls might be near $2.150.
Another Decline?If XRP fails to clear the $1.950 resistance zone, it could start a fresh decline. Initial support on the downside is near the $1.880 level. The next major support is near the $1.860 level and the 61.8% Fib retracement level of the upward move from the $1.810 swing low to the $1.945 high.
If there is a downside break and a close below the $1.860 level, the price might continue to decline toward $1.8320. The next major support sits near the $1.80 zone, below which the price could continue lower toward $1.7650.
Technical Indicators
Hourly MACD – The MACD for XRP/USD is now gaining pace in the bearish zone.
Hourly RSI (Relative Strength Index) – The RSI for XRP/USD is now below the 50 level.
Major Support Levels – $1.880 and $1.860.
Major Resistance Levels – $1.950 and $2.00.
Why this matters
XRP is a tracked market entity in the DigitalMoneyBox archive, making this useful context for readers monitoring repeated mentions and follow-up coverage.
Original source
Read on NewsBTCRelated market context

Ethereum Price Eyes $2,000 as AI Funds Shift From Chips to ETH, Says Tom Lee
Ethereum is pressing against a price level that has capped every rally. ETH trades at $1,925, little changed over the past 24 hour...

Sky Protocol Revenue Nears $419M Annualized As USDS Demand Supports DeFi Income
Sky Protocol’s annualized gross revenue has climbed close to $419 million, according to its governance status dashboard, giving De...

Worldcoin (WLD) Price Prediction: Can Grayscale’s Worldcoin ETF Filing Trigger a WLD Rebound Above $0.45?
The filing has put the token back in focus at a time when WLD remains well below its recent 2026 highs and technical indicators co...

XRP Price Could Turn Volatile This Month: What’s at Stake for Ripple?
XRP price is trading around $1.13, up about 2% over the past 24 hours. Those modest gains hide a much larger binary risk approachi...
Bitcoin Price Prediction: Bitcoin Volatility Hits 2016 Low, Could Trigger Liquidations
Bitcoin price is trading around $66,100, after climbing above $66,500 earlier in the session, in a bullish prediction environment....

Ethereum ETF Inflows Extend To Third Day As BlackRock Offsets Fidelity Outflows
US spot Ethereum ETFs have recorded a third consecutive day of net inflows, giving ETH traders another sign that institutional dem...