XRP Price Targets Recovery — Signs of Strength Emerging
XRP price started a fresh decline below the $2.320 zone. The price is now correcting losses and might aim for a move above the $2.350 resistance. XRP price started a fresh decline below the $2.300 zone. The price is now...
Archive context
Older archive item. Useful for background and entity history, but not a fresh market-moving signal.

XRP price started a fresh decline below the $2.320 zone. The price is now correcting losses and might aim for a move above the $2.350 resistance.
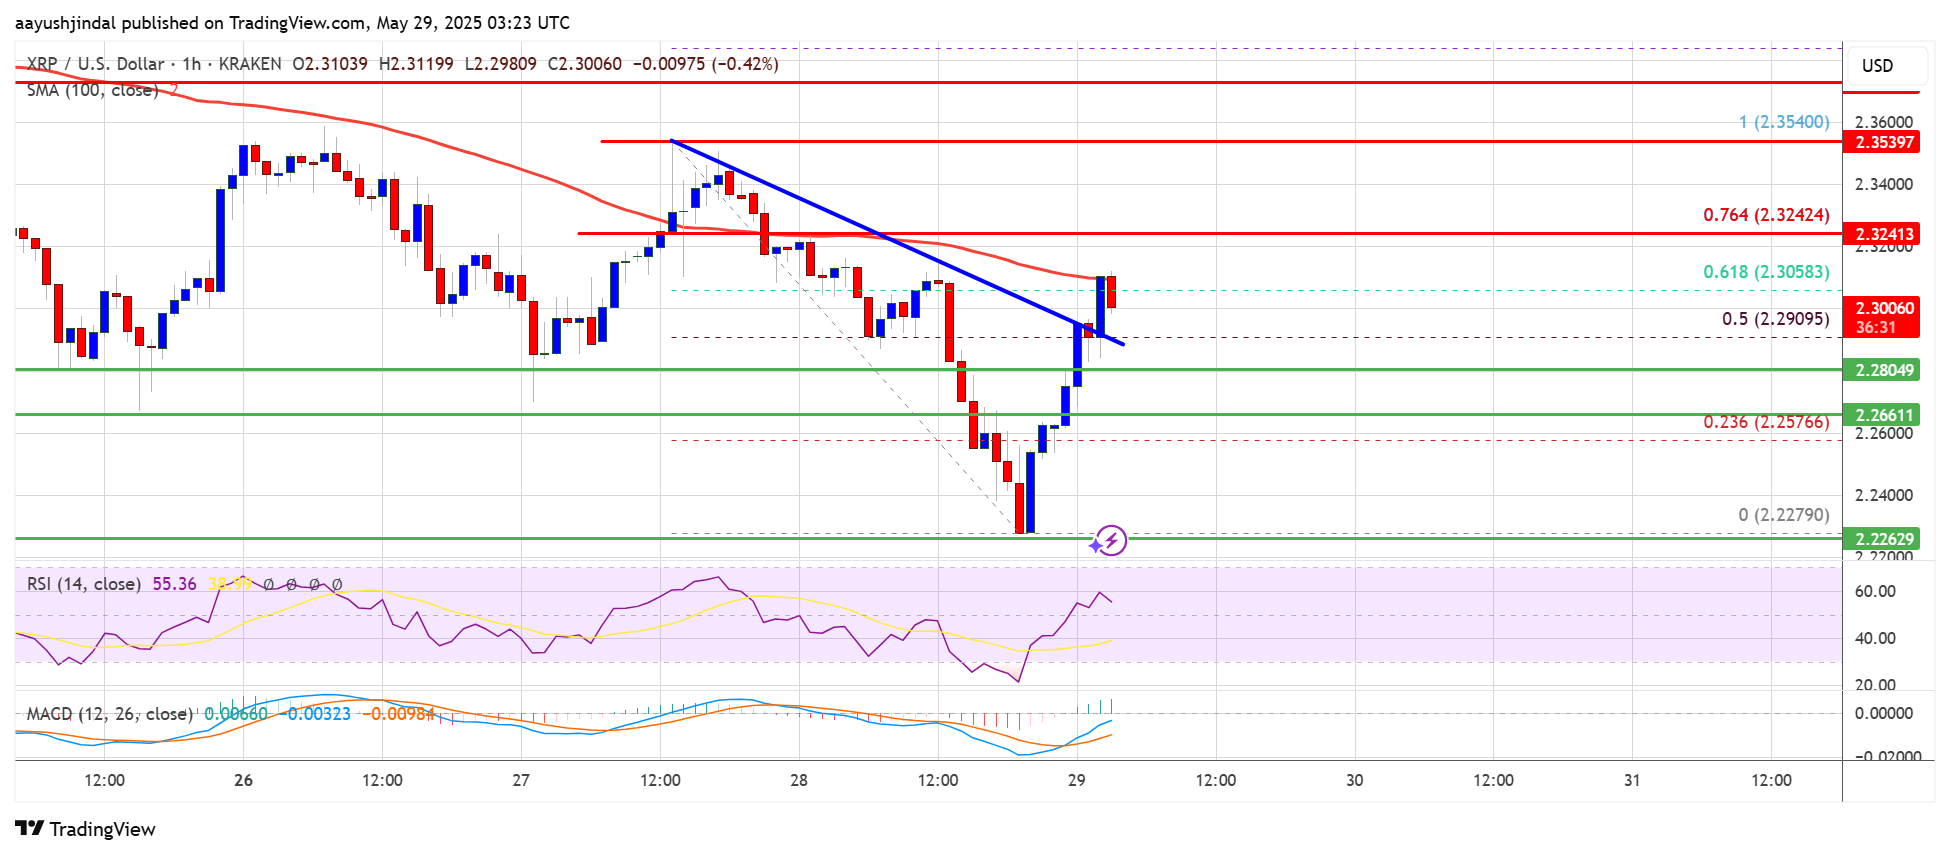
- XRP price started a fresh decline below the $2.300 zone.
- The price is now trading below $2.320 and the 100-hourly Simple Moving Average.
- There was a break above a connecting bearish trend line with resistance at $2.2920 on the hourly chart of the XRP/USD pair (data source from Kraken).
- The pair might start another decline if it fails to clear the $2.3250 level.
XRP price found support at $2.220 and recently started a recovery wave, unlike Bitcoin and Ethereum. There was a move above the $2.2650 and $2.280 resistance levels,
There was a move above the 50% Fib retracement level of the downward wave from the $2.3540 swing high to the $2.2279 low. Besides, there was a break above a connecting bearish trend line with resistance at $2.2920 on the hourly chart of the XRP/USD pair.
However, the bears were active near the $2.30 level. The price is now trading below $2.320 and the 100-hourly Simple Moving Average. On the upside, the price might face resistance near the $2.3250 level. It is near the 76.4% Fib retracement level of the downward wave from the $2.3540 swing high to the $2.2279 low.
The first major resistance is near the $2.3350 level. The next resistance is $2.350. A clear move above the $2.350 resistance might send the price toward the $2.40 resistance. Any more gains might send the price toward the $2.420 resistance or even $2.450 in the near term. The next major hurdle for the bulls might be $2.50.
Another Drop?If XRP fails to clear the $2.320 resistance zone, it could start another decline. Initial support on the downside is near the $2.280 level. The next major support is near the $2.260 level.
If there is a downside break and a close below the $2.260 level, the price might continue to decline toward the $2.2320 support. The next major support sits near the $2.20 zone.
Technical Indicators
Hourly MACD – The MACD for XRP/USD is now gaining pace in the bullish zone.
Hourly RSI (Relative Strength Index) – The RSI for XRP/USD is now above the 50 level.
Major Support Levels – $2.280 and $2.260.
Major Resistance Levels – $2.320 and $2.340.
Why this matters
This altcoin story adds another data point to the current market tape and is useful when read alongside nearby source coverage.
Original source
Read on NewsBTCRelated market context

Solana Price Prediction: SOL Holds Near $81 as Breakout Setup Points to $87, but Whale Flows Keep Risk Active
Solana price is back in focus after a sharp recovery pushed SOL towards the $81 area. The move has improved short-term momentum, e...

Leading Claude AI Fable 5 Predicts Stunning XRP Price by The End of 2026
Anthropic’s new Claude AI model, Fable 5, predicts XRP price for the entire second half around a single event that could be resolv...

Hyperliquid (HYPE) Price Prediction: Symmetrical Triangle Breakout Puts $77 Target Back in Focus
The breakout comes after several sessions of price compression, with HYPE continuing to trade within a broader technical structure...

Mark Zuckerberg’s Meta AI Predicts Unbelievable Bitcoin Price by the End of 2026
Mark Zuckerberg’s Meta AI predicts and stacks 4 numbered catalysts behind its Bitcoin price prediction that puts $120,000 to $150,...

XRP Price Prediction: SuperTrend Buy Signal Meets Shrinking Supply as $1.24 Breakout Comes Into Focus
After a fresh SuperTrend buy signal appeared on the 4-hour chart, analysts are watching whether the XRP price can extend its recen...

Bitcoin whales send 49,000 BTC to exchanges as $60K rebound shows signs of weakness
Bitcoin’s recovery above $60,000 is facing a fresh test from exchange-flow and derivatives data after large holders moved one of t...