XRP Price Turns Soft, Red Signals Renewed Bearish Pressure
XRP price extended losses and traded below $1.40. The price is now consolidating losses but faces hurdles near $1.3750 and $1.40. XRP price started another decline and traded below the $1.40 zone. The price is now tradin...

XRP price extended losses and traded below $1.40. The price is now consolidating losses but faces hurdles near $1.3750 and $1.40.
- XRP price started another decline and traded below the $1.40 zone.
- The price is now trading below $1.3880 and the 100-hourly Simple Moving Average.
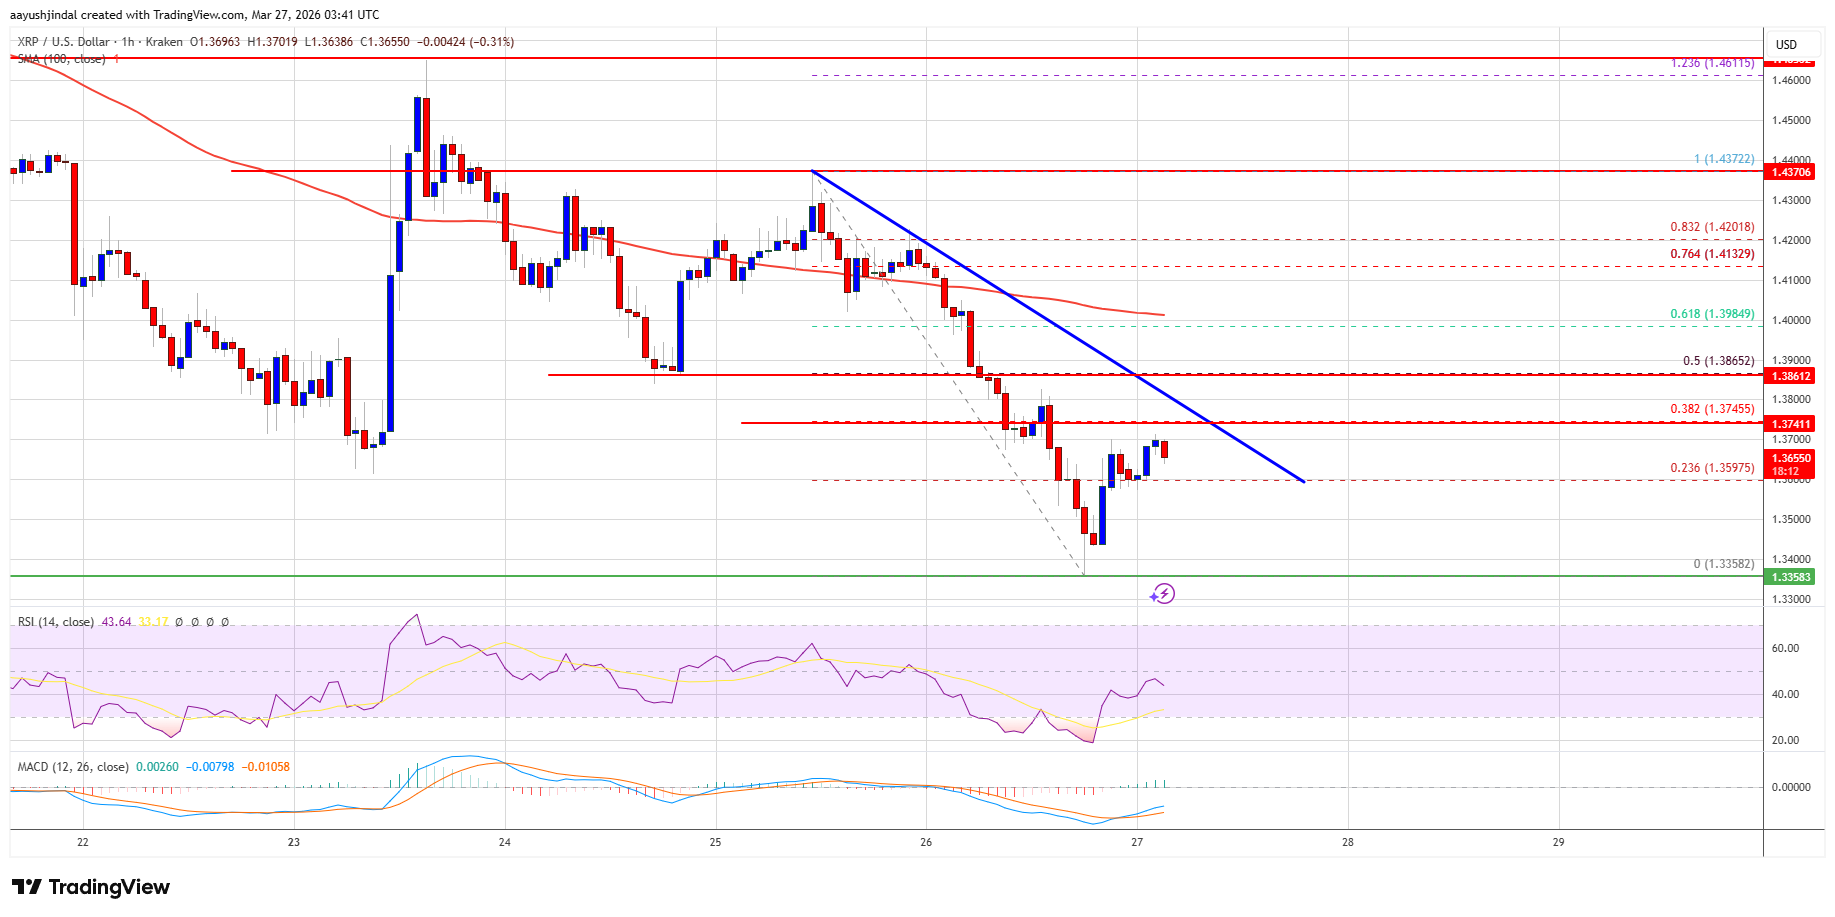
- There is a bearish trend line forming with resistance at $1.3750 on the hourly chart of the XRP/USD pair (data source from Kraken).
- The pair could continue to move down if it stays below $1.40.
XRP price failed to stay above $1.4120 and extended its decline, like Bitcoin and Ethereum. The price declined below $1.40 and $1.3880 to enter a short-term bearish zone.
The price even extended losses below $1.3750. A low was formed at $1.3358, and the price is now consolidating losses below the 38.2% Fib retracement level of the downward move from the $1.4372 swing high to the $1.3358 low.
The price is now trading below $1.40 and the 100-hourly Simple Moving Average. If there is a fresh recovery move, the price might face resistance near the $1.3750 level. There is also a bearish trend line forming with resistance at $1.3750 on the hourly chart of the XRP/USD pair.
The first major resistance is near the $1.3850 level or the 50% Fib retracement level of the downward move from the $1.4372 swing high to the $1.3358 low. The main resistance could be $1.40.
A close above $1.40 could send the price to $1.4120. The next hurdle sits at $1.4380. A clear move above the $1.4380 resistance might send the price toward the $1.450 resistance. Any more gains might send the price toward the $1.4650 resistance. The next major hurdle for the bulls might be near $1.50.
Another Decline?If XRP fails to clear the $1.40 resistance zone, it could start a fresh decline. Initial support on the downside is near the $1.350 level. The next major support is near the $1.3350 level.
If there is a downside break and a close below the $1.3350 level, the price might continue to decline toward $1.3220. The next major support sits near the $1.3150 zone, below which the price could continue lower toward $1.30.
Technical Indicators
Hourly MACD – The MACD for XRP/USD is now gaining pace in the bearish zone.
Hourly RSI (Relative Strength Index) – The RSI for XRP/USD is now below the 50 level.
Major Support Levels – $1.3500 and $1.3350.
Major Resistance Levels – $1.3850 and $1.4000.
Original source
Read on NewsBTCRelated market context

Ethereum Nears 200 Million Non-Empty Wallets Despite Market Uncertainty
Despite persistent market uncertainty and bearish sentiment across parts of the cryptocurrency sector, Ethereum is approaching a s...

XRP aims for $0.90 as ETF demand battles selling pressure from whales
XRP is trading at $1.11, down roughly 17% from its June opening, having set a new 2026 low on June 5 and shed $8 billion in market...

Ethereum Price Prediction: 3 Million ETH Rushes Into Staking as Sellers Vanish
Is nobody leaving Ethereum? A record 36 million ETH is now locked in staking, roughly 29–30% of the circulating supply, and the va...

Ethereum Futures Just Hit A Binance Record: Are Traders Calling The Bottom?
Ethereum derivatives activity is flashing a fresh signal on Binance, where open interest measured in ETH terms has reached a new a...

The 3-Part Impulse That Shows Where The XRP Price Is Headed Next
XRP bulls are trying to turn a brutal selloff into something bigger than a relief bounce. An interesting setup shows a possible th...

Most Traders Will Scroll Past This Grok AI Bitcoin Predicts, Big Mistake
Elon Musk Grok AI just looked at a Bitcoin chart down more than 50% and predicts it’s a classic accumulation zone, targeting $150,...