XRP Price Walks a Tightrope As Downside Threat Persists
XRP price failed to surpass $1.4650 and started another decline. The price is now correcting gains and might struggle to stay above $1.320. XRP price started a downside correction and declined below $1.40. The price is n...
Archive context
Older archive item. Useful for background and entity history, but not a fresh market-moving signal.

XRP price failed to surpass $1.4650 and started another decline. The price is now correcting gains and might struggle to stay above $1.320.
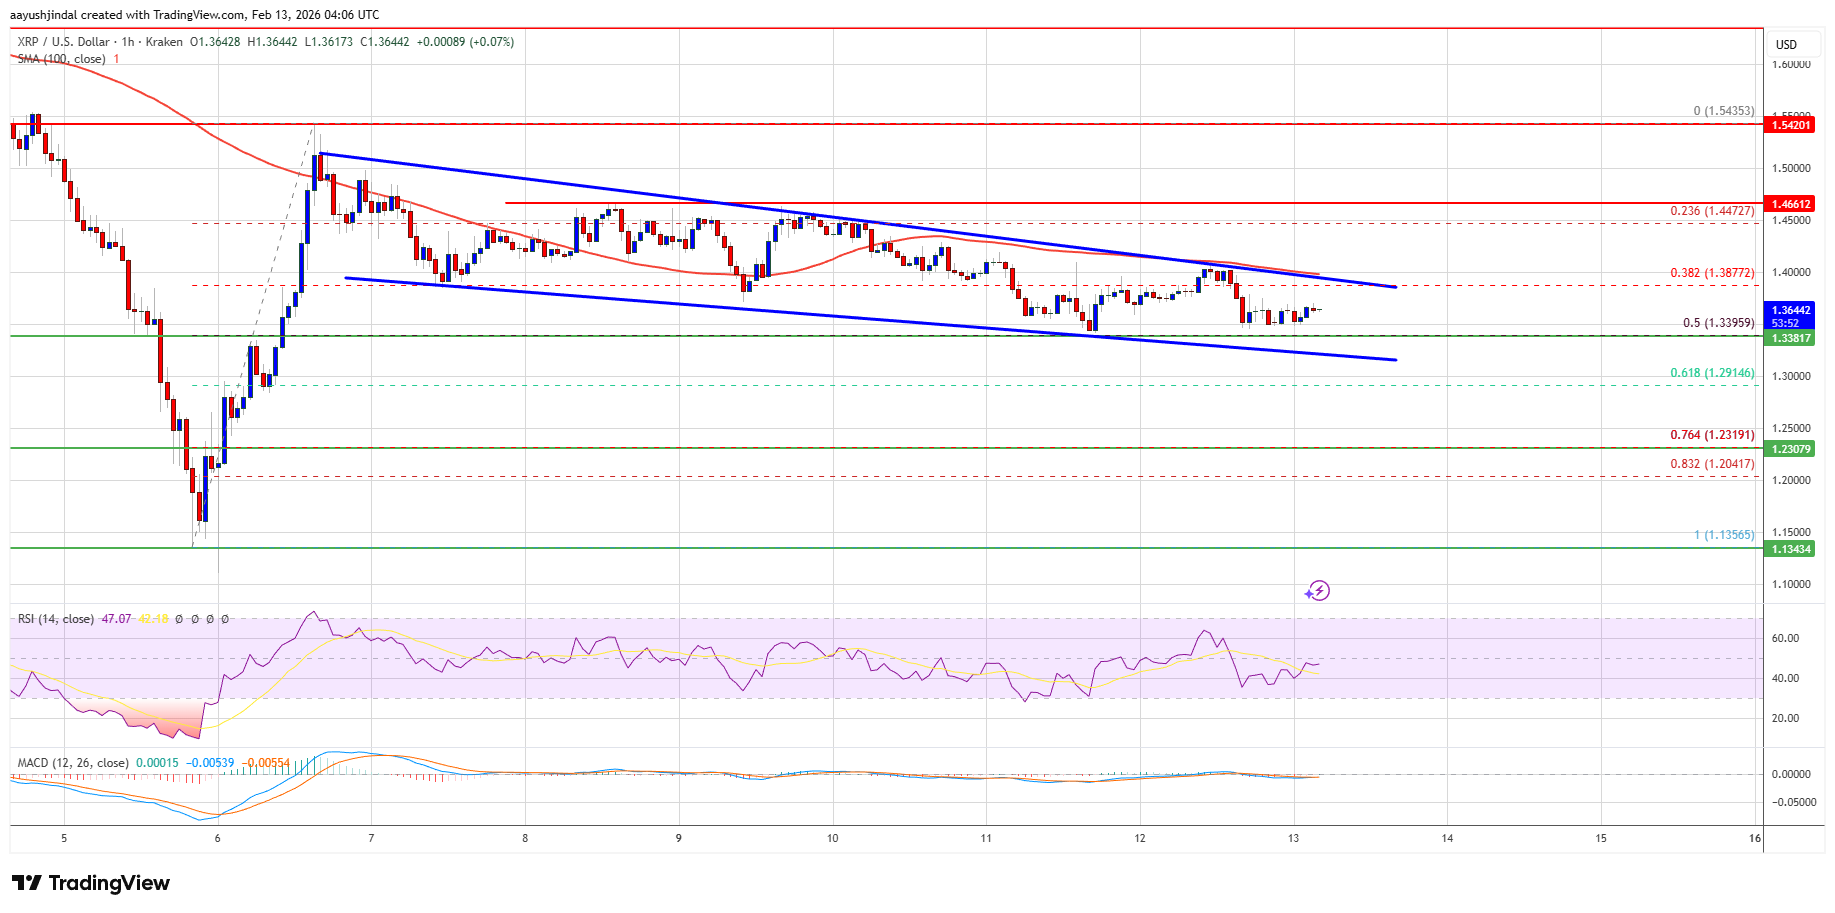
- XRP price started a downside correction and declined below $1.40.
- The price is now trading below $1.380 and the 100-hourly Simple Moving Average.
- There is a declining channel forming with resistance at $1.3880 on the hourly chart of the XRP/USD pair (data source from Kraken).
- The pair could start another increase if it stays above $1.30.
XRP price failed to stay above $1.4650 and started a downside correction, like Bitcoin and Ethereum. The price dipped below the $1.420 and $1.40 levels to enter a negative zone.
The price even tested the 50% Fib retracement level of the upward move from the $1.1356 swing low to the $1.5435 high. The bulls are now active near the $1.340 zone. Besides, there is a declining channel forming with resistance at $1.3880 on the hourly chart of the XRP/USD pair.
The price is now trading below $1.3850 and the 100-hourly Simple Moving Average. If there is a fresh upward move, the price might face resistance near the $1.3880 level. The first major resistance is near the $1.40 level, above which the price could rise and test $1.420.
A clear move above the $1.420 resistance might send the price toward the $1.450 resistance. Any more gains might send the price toward the $1.4820 resistance. The next major hurdle for the bulls might be near $1.50.
Downside Continuation?If XRP fails to clear the $1.40 resistance zone, it could start a fresh decline. Initial support on the downside is near the $1.340 level. The next major support is near the $1.30 level or the 61.8% Fib retracement level of the upward move from the $1.1356 swing low to the $1.5435 high at $1.2920.
If there is a downside break and a close below the $1.2920 level, the price might continue to decline toward $1.2650. The next major support sits near the $1.250 zone, below which the price could continue lower toward $1.2250.
Technical Indicators
Hourly MACD – The MACD for XRP/USD is now gaining pace in the bearish zone.
Hourly RSI (Relative Strength Index) – The RSI for XRP/USD is now below the 50 level.
Major Support Levels – $1.340 and $1.2920.
Major Resistance Levels – $1.3880 and $1.40.
Why this matters
XRP is a tracked market entity in the DigitalMoneyBox archive, making this useful context for readers monitoring repeated mentions and follow-up coverage.
Original source
Read on NewsBTCRelated market context
Ethereum Price Eyes $2,000 as AI Funds Shift From Chips to ETH, Says Tom Lee
Ethereum is pressing against a price level that has capped every rally. ETH trades at $1,925, little changed over the past 24 hour...

Worldcoin (WLD) Price Prediction: Can Grayscale’s Worldcoin ETF Filing Trigger a WLD Rebound Above $0.45?
The filing has put the token back in focus at a time when WLD remains well below its recent 2026 highs and technical indicators co...

XRP Price Prediction: XRP Holds Above $1.14 as Bulls Battle to Reverse the Broader Downtrend
The move has improved the short-term technical picture, but the broader trend remains under pressure as XRP continues to trade bel...
Ethereum News: Builder Activity & Leverage Data Align, $2k Next?
In Ethereum news today, new smart contract deployments on the network have surged 192% above the 90-day baseline, with funding rat...

Sky Protocol Revenue Nears $419M Annualized As USDS Demand Supports DeFi Income
Sky Protocol’s annualized gross revenue has climbed close to $419 million, according to its governance status dashboard, giving De...

Ethereum Security Team Turns To AI Agents For Vulnerability Triage
The Ethereum Foundation’s Protocol Security team is using coordinated AI agents to help scan protocol repositories and devnets for...