XRP Price Warning: Larger Correction Looms After Recent Weakness
XRP price is struggling to clear the $3.080 resistance zone. The price is now declining and might extend losses if it drops below $2.920. XRP price is correcting gains from the $3.080 resistance. The price is now trading...
Archive context
Older archive item. Useful for background and entity history, but not a fresh market-moving signal.
XRP price is struggling to clear the $3.080 resistance zone. The price is now declining and might extend losses if it drops below $2.920.
- XRP price is correcting gains from the $3.080 resistance.
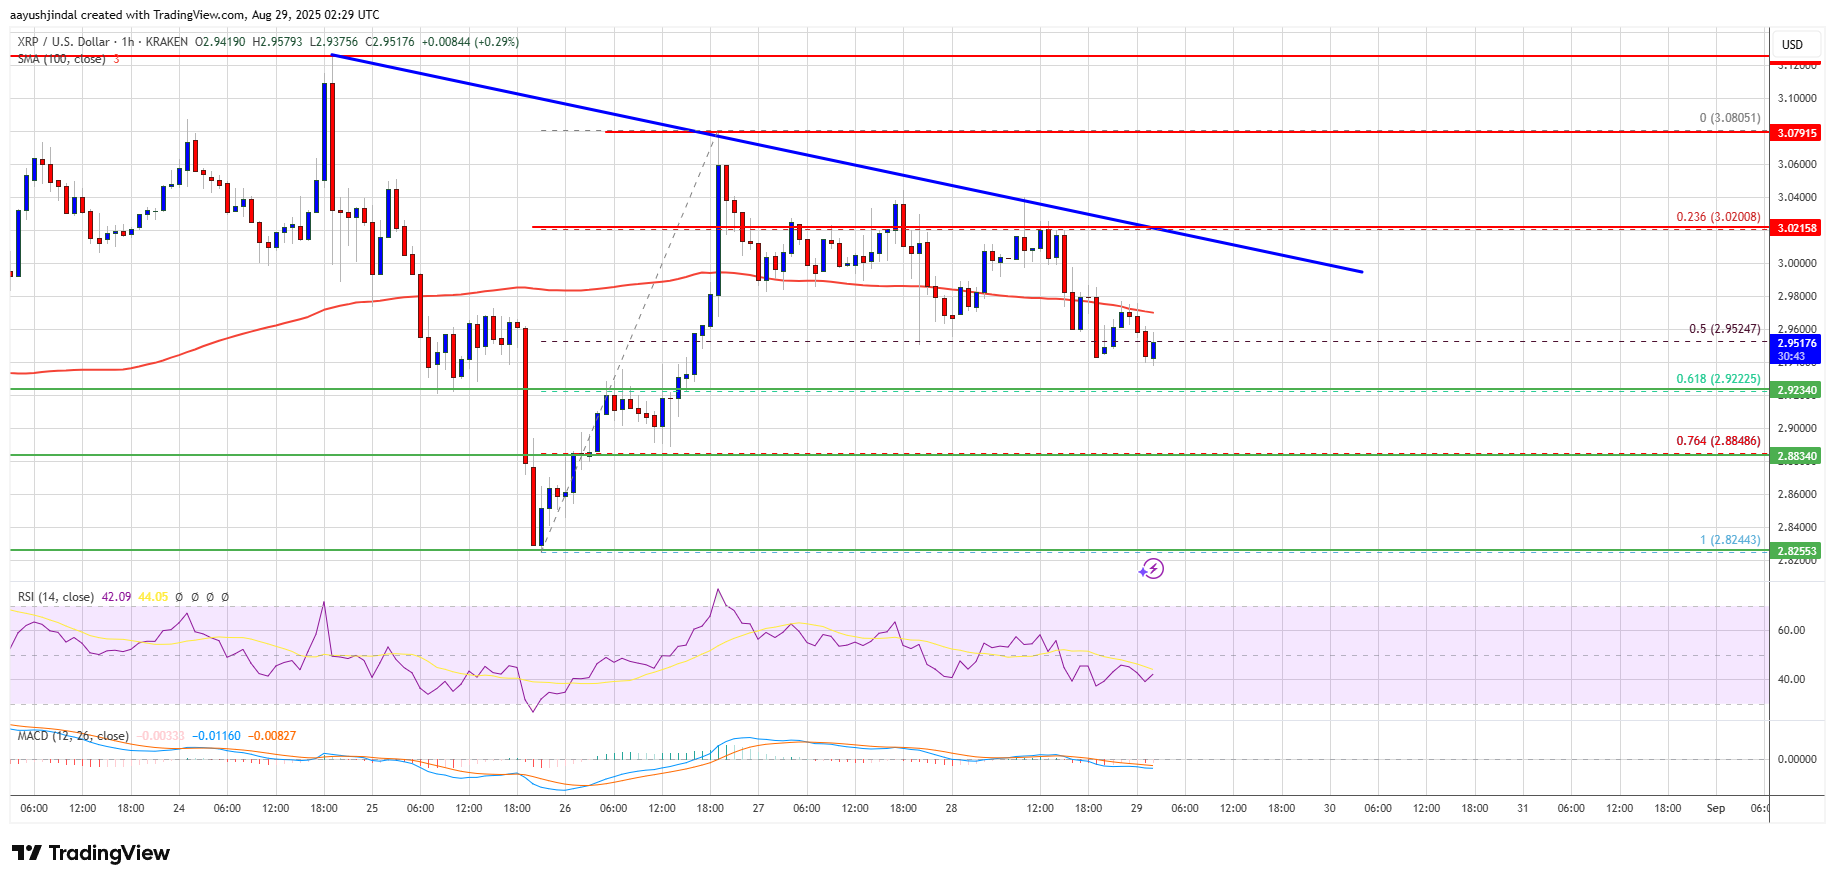
- The price is now trading near $2.9650 and the 100-hourly Simple Moving Average.
- There is a key bearish trend line forming with resistance at $3.020 on the hourly chart of the XRP/USD pair (data source from Kraken).
- The pair could continue to decline if it stays below the $3.050 zone.
XRP price started a downside correction from $3.0850, like Bitcoin and Ethereum. The price traded below the $3.0650 and $3.050 levels.
The bears were able to push the price below $2.980 and the 100-hourly Simple Moving Average. Moreover, there was a spike below the 50% Fib retracement level of the upward move from the $2.824 swing low to the $3.080 high.
The price is now trading below $2.9650 and the 100-hourly Simple Moving Average. There is also a key bearish trend line forming with resistance at $3.020 on the hourly chart of the XRP/USD pair.
If the bulls protect the $2.920 support, the price could attempt another increase. On the upside, the price might face resistance near the $3.00 level. The first major resistance is near the $3.020 level. A clear move above the $3.020 resistance might send the price toward the $3.080 resistance. Any more gains might send the price toward the $3.120 resistance. The next major hurdle for the bulls might be near $3.150.
More Losses?If XRP fails to clear the $3.020 resistance zone, it could continue to move down. Initial support on the downside is near the $2.920 level or the 61.8% Fib retracement level of the upward move from the $2.824 swing low to the $3.080 high. The next major support is near the $2.8850 level.
If there is a downside break and a close below the $2.8850 level, the price might continue to decline toward $2.80. The next major support sits near the $2.780 zone, below which the price could gain bearish momentum.
Technical Indicators
Hourly MACD – The MACD for XRP/USD is now gaining pace in the bearish zone.
Hourly RSI (Relative Strength Index) – The RSI for XRP/USD is now below the 50 level.
Major Support Levels – $2.920 and $2.840.
Major Resistance Levels – $3.020 and $3.080.
Why this matters
This altcoin story adds another data point to the current market tape and is useful when read alongside nearby source coverage.
Original source
Read on NewsBTCRelated market context

XRP Price Prediction: XRP Faces Critical Resistance Near $1.17 Despite Ripple Securing Landmark EU License
While the company secured a full MiCA license that expands its operations across the European Economic Area, market indicators sug...

Sam Altman ChatGPT AI Predicts Insane Bitcoin Price by 2026
Sam Altman ChatGPT AI just circled November on the calendar and put a number next to Bitcoin Price Prediction. The model predicts...

Ethereum is losing ownership of crypto payments as Base moves $565B in stablecoins
Stablecoin activity is becoming a contest over which blockchains move the most tokenized dollars. Visa Onchain Analytics showed th...

Iran shoots down US MQ-9 Reaper drone, Bitcoin drops below $73K as nearly $1B in crypto liquidations follow
Geopolitical tensions highlight crypto market volatility, underscoring the interconnectedness with traditional finance and potenti...

Elon Musk Grok AI Predicts Incredible XRP Price Target by End of 2026
Elon Musk Grok AI just published what might be the most partnership-heavy XRP price prediction in this entire series. The model pr...
Solana’s $8.7B RWA surge shows tokenized assets are finally starting to move
Solana’s real-world asset transfer volume more than doubled over the past month, giving the network a stronger signal that tokeniz...