XRP Price Weakens—Further Losses on The Table?
XRP price started a fresh decline below the $2.120 zone. The price is now consolidating above $2.00 and remains at risk of more losses below $2.00. XRP price started a fresh decline below the $2.150 zone. The price is no...
Archive context
Older archive item. Useful for background and entity history, but not a fresh market-moving signal.
XRP price started a fresh decline below the $2.120 zone. The price is now consolidating above $2.00 and remains at risk of more losses below $2.00.
- XRP price started a fresh decline below the $2.150 zone.
- The price is now trading below $2.120 and the 100-hourly Simple Moving Average.
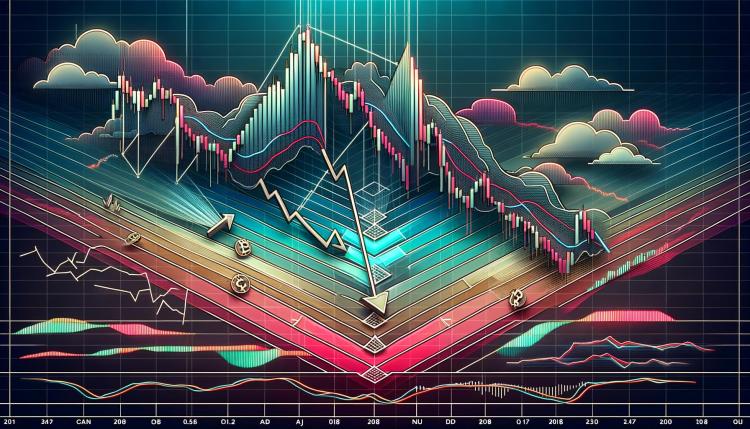
- There is a key bearish trend line forming with resistance at $2.10 on the hourly chart of the XRP/USD pair (data source from Kraken).
- The pair might extend losses if there is a close below the $2.00 support zone.
XRP price started another decline below the $2.20 zone, like Bitcoin and Ethereum. The price traded below the $2.150 and $2.120 levels to enter a bearish zone.
The price even spiked below $2.050 before the bulls appeared. A low was formed at $2.036 and the price is now consolidating losses. There was a minor increase above the $2.10 level. However, the bears were active near the 50% Fib retracement level of the downward move from the $2.184 swing high to the $2.036 low.
The price is now trading below $2.10 and the 100-hourly Simple Moving Average. On the upside, the price might face resistance near the $2.10 level. There is also a key bearish trend line forming with resistance at $2.10 on the hourly chart of the XRP/USD pair.
The first major resistance is near the $2.1280 level and the 61.8% Fib retracement level of the downward move from the $2.184 swing high to the $2.036 low. The next resistance is $2.1850. A clear move above the $2.1850 resistance might send the price toward the $2.250 resistance. Any more gains might send the price toward the $2.320 resistance or even $2.350 in the near term. The next major hurdle for the bulls might be $2.50.
More Losses?If XRP fails to clear the $2.10 resistance zone, it could start another decline. Initial support on the downside is near the $2.040 level. The next major support is near the $2.00 level.
If there is a downside break and a close below the $2.00 level, the price might continue to decline toward the $1.920 support. The next major support sits near the $1.840 zone.
Technical Indicators
Hourly MACD – The MACD for XRP/USD is now gaining pace in the bearish zone.
Hourly RSI (Relative Strength Index) – The RSI for XRP/USD is now below the 50 level.
Major Support Levels – $2.040 and $2.00.
Major Resistance Levels – $2.10 and $2.1850.
Why this matters
This altcoin story adds another data point to the current market tape and is useful when read alongside nearby source coverage.
Original source
Read on NewsBTCRelated market context

Leading Claude AI Fable 5 Predicts Stunning XRP Price by The End of 2026
Anthropic’s new Claude AI model, Fable 5, predicts XRP price for the entire second half around a single event that could be resolv...

Mark Zuckerberg’s Meta AI Predicts Unbelievable Bitcoin Price by the End of 2026
Mark Zuckerberg’s Meta AI predicts and stacks 4 numbered catalysts behind its Bitcoin price prediction that puts $120,000 to $150,...

Bitcoin whales send 49,000 BTC to exchanges as $60K rebound shows signs of weakness
Bitcoin’s recovery above $60,000 is facing a fresh test from exchange-flow and derivatives data after large holders moved one of t...

Micron stock soars nearly 700% in a year as tokenized version trades on Ethereum via Ondo
Micron's stock surge and tokenization highlight the growing intersection of traditional finance and decentralized finance, impacti...

XRP Price Prediction: SuperTrend Buy Signal Meets Shrinking Supply as $1.24 Breakout Comes Into Focus
After a fresh SuperTrend buy signal appeared on the 4-hour chart, analysts are watching whether the XRP price can extend its recen...

XRP vs Bitcoin: Investor Says RLUSD Growth and Regulatory Clarity Could Shift Crypto’s Balance of Power
While the claim remains highly ambitious given Bitcoin’s commanding lead in market capitalization, the discussion highlights broad...