XRP Price Weakness Builds, Traders Brace For Fresh Selloff
XRP price started a downside correction from the $1.3740 zone. The price is now consolidating and might aim for another increase if it stays above the $1.320 zone. XRP price started a downside correction after it failed...
Archive context
Older archive item. Useful for background and entity history, but not a fresh market-moving signal.

XRP price started a downside correction from the $1.3740 zone. The price is now consolidating and might aim for another increase if it stays above the $1.320 zone.
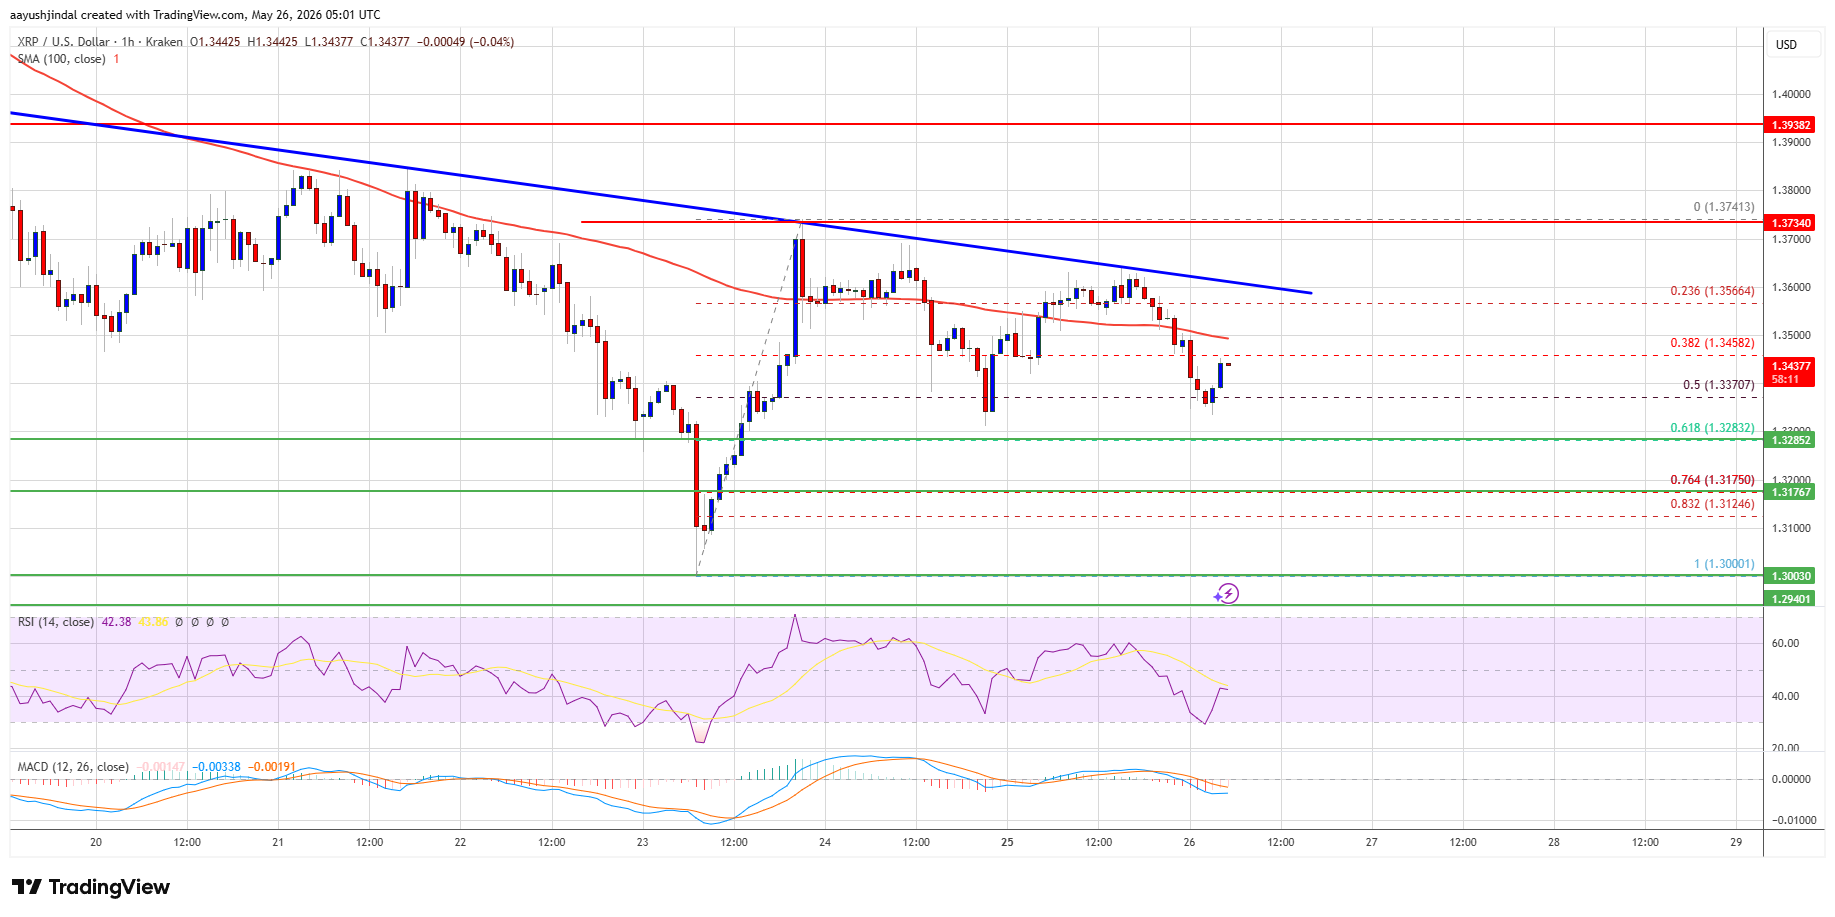
- XRP price started a downside correction after it failed to stay above the $1.3620 zone.
- The price is now trading below $1.3580 and the 100-hourly Simple Moving Average.
- There is a bearish trend line forming with resistance at $1.360 on the hourly chart of the XRP/USD pair (data source from Kraken).
- The pair could start a fresh increase if it settles above $1.3620.
XRP price struggled to stay above $1.3720 and started a fresh decline, like Bitcoin and Ethereum. The price dipped below the $1.3620 and $1.3600 levels.
The price declined below $1.3550 and even spiked below the 50% Fib retracement level of the upward move from the $1.30 swing low to the $1.3740 high. Besides, there is a bearish trend line forming with resistance at $1.360 on the hourly chart of the XRP/USD pair.
The price is now trading below $1.3520 and the 100-hourly Simple Moving Average. If there is a fresh upward move, the price might face resistance near the $1.350 level. The first major resistance is near the $1.3560 level, above which the price could rise and test $1.360.
A clear move above the $1.360 resistance might send the price toward the $1.3720 resistance. Any more gains might send the price toward the $1.3750 resistance. The next major hurdle for the bulls might be near $1.380.
Downside Extension?If XRP fails to clear the $1.360 resistance zone, it could start a fresh decline. Initial support on the downside is near the $1.330 level. The next major support is near the $1.3280 level and the 61.8% Fib retracement level of the upward move from the $1.30 swing low to the $1.3740 high.
If there is a downside break and a close below the $1.3280 level, the price might continue to decline toward $1.3175. The next major support sits near the $1.3120 zone, below which the price could continue lower toward $1.3050. Any more losses might call for a test of $1.30.
Technical Indicators
Hourly MACD – The MACD for XRP/USD is now gaining pace in the bearish zone.
Hourly RSI (Relative Strength Index) – The RSI for XRP/USD is now below the 50 level.
Major Support Levels – $1.3280 and $1.3120.
Major Resistance Levels – $1.3550 and $1.3750.
Why this matters
XRP is a tracked market entity in the DigitalMoneyBox archive, making this useful context for readers monitoring repeated mentions and follow-up coverage.
Original source
Read on NewsBTCRelated market context

Ethereum (ETH) Price Prediction: $2,000 or $1,680 Next as ETH Reaches a Critical Turning Point
Ethereum price has fallen back below $1,900 after buyers failed to maintain the latest recovery, leaving ETH positioned between an...

Ethereum Price Prediction: Blackrock Backed Stablecoin to Launch on ETH
Ethereum price is trading near $1,900, but the market may be underestimating a major institutional development that could boost it...

If Bitcoin breaks $62k over the weekend, a $1.1B short overhang stands ready to pull price down to $60k
Bitcoin enters the weekend near $62,900, less than 1% above the July 31 intraday low, and Deribit has already settled roughly $9.6...

Bitcoin (BTC) Price Today: Michael Saylor’s Strategy Reports $8.3B Loss as BTC Slides Below $64K
The BTC move comes shortly after Strategy reported an $8.33 billion operating loss for the second quarter of 2026, including an $8...

Trump Crypto Empire Under Fire After Poll Shows Majority Disapprove
The political heat around Donald Trump’s crypto holdings is translating into pressure across politically linked digital assets. Th...

Bitcoin Price Prediction: $10 Billion of BTC and ETH Option Expiry Hitting the Market Today
The largest single-day options expiry in recent months is clearing today, and the market is already pricing in the friction. Bitco...