XRP Pulls Back, But TD Sequential Flashes Buy Signal
A crypto analyst has highlighted how the Tom Demark (TD) Sequential has given a buy signal for XRP following its latest pullback. XRP Has Seen A TD Sequential Signal On Its 4-Hour Chart In a new post on X, analyst Ali Ma...
Archive context
Older archive item. Useful for background and entity history, but not a fresh market-moving signal.

A crypto analyst has highlighted how the Tom Demark (TD) Sequential has given a buy signal for XRP following its latest pullback.
XRP Has Seen A TD Sequential Signal On Its 4-Hour ChartIn a new post on X, analyst Ali Martinez has shared a TD Sequential signal that has appeared in the 4-hour price of XRP. The “TD Sequential” here refers to an indicator from technical analysis (TA) that’s generally used for pinpointing potential locations of reversal in an asset’s price.
The indicator involves two phases. In the first phase, called the setup, candles of the same color are counted up to nine. Once these nine candles, which don’t have to be consecutive, have been printed on the chart, the TD Sequential flashes a reversal signal. Naturally, if the candles leading up to the setup’s completion were green, then the signal acts as a bearish one, while them being red implies a possible bottom formation.
After the setup is over, the second phase, known as the countdown, picks up. This phase works pretty similarly to the first one, with the only difference being that it involves a total of thirteen candles, not nine. Following the end of the countdown, the price is assumed to have arrived at another point of trend exhaustion.
Now, here is a chart that shows the TD Sequential signal that has emerged for XRP on the 4-hour timeframe recently:
As displayed in the above graph, the XRP 4-hour price has just seen the emergence of a TD Sequential setup. This signal has arrived as the cryptocurrency has dropped more than 4% from its $1.45 high.
Since the candles involved have been red ones, the setup’s completion suggests that a bullish reversal could happen next for the asset in the short term. “To me, this suggests the local exhaustion is over, and XRP is ready to rebound,” said Martinez.
The analyst noted that the TD Sequential has been accurate at anticipating trend shifts in the token recently. One example of this is visible in the chart; the $1.45 high from earlier this week coincided with a sell signal in the indicator.
“I’m looking for a move back toward the $1.45 resistance, with a secondary target of $1.80 once we clear the overhead supply,” added Martinez. It now remains to be seen whether the signal will pay off for the cryptocurrency or if the bearish trend will continue in the near future, invalidating the setup.
XRP PriceAt the time of writing, XRP is trading around $1.39, down 1.5% in the last 24 hours.
Why this matters
XRP is a tracked market entity in the DigitalMoneyBox archive, making this useful context for readers monitoring repeated mentions and follow-up coverage.
Original source
Read on NewsBTCRelated market context

Bitcoin (BTC) Price Prediction: TD Sequential Sell Signal and Weak August History Raise Pullback Risks
The latest market snapshots show Bitcoin trading near $63,000–$64,000, with traders watching whether support around $62,800 can ho...

Ethereum (ETH) Price Prediction: $2,000 or $1,680 Next as ETH Reaches a Critical Turning Point
Ethereum price has fallen back below $1,900 after buyers failed to maintain the latest recovery, leaving ETH positioned between an...
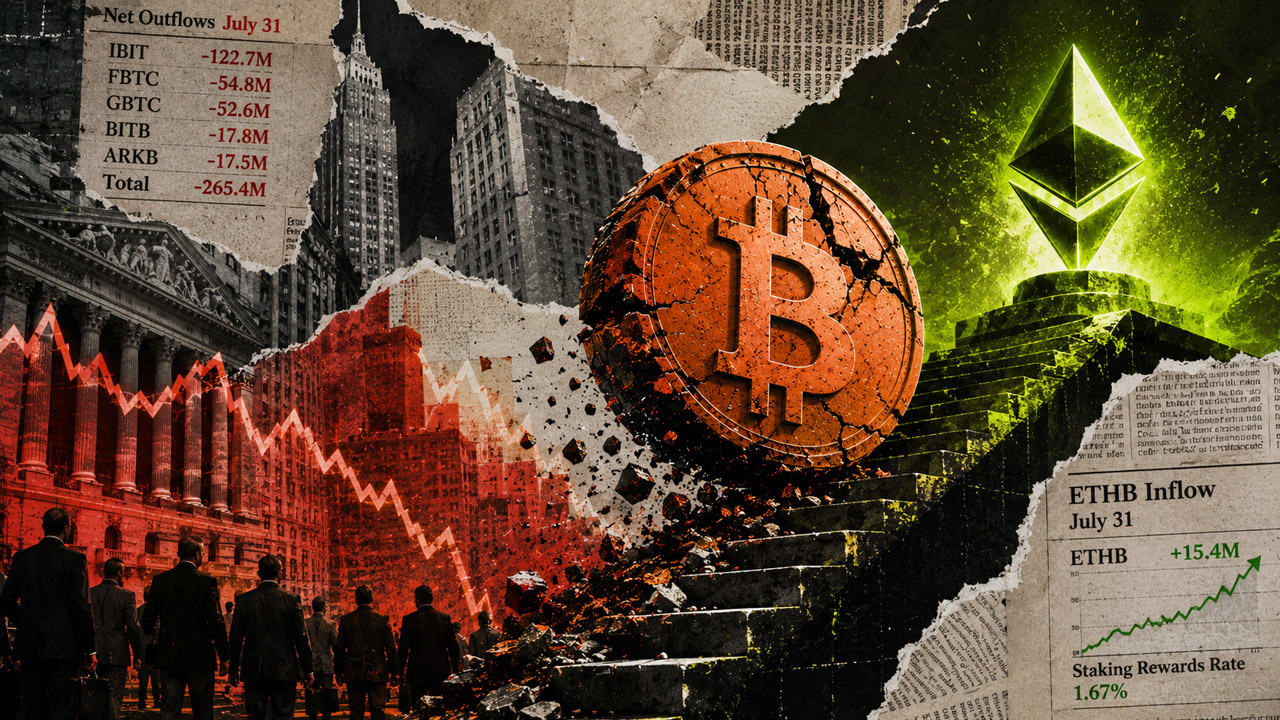
Bitcoin ETFs just bled $265M in a brutal 24 hours, and Ethereum’s supposed rescue is another BlackRock illusion
U.S. spot Bitcoin funds posted net outflows of $265.4 million on July 31, reversing a $233.1 million inflow the previous session....

Bitcoin (BTC) Price Today: Michael Saylor’s Strategy Reports $8.3B Loss as BTC Slides Below $64K
The BTC move comes shortly after Strategy reported an $8.33 billion operating loss for the second quarter of 2026, including an $8...

Ripple Just Got Full MiCA Authorization in Europe But Fed’s Hawkish Tone Is Keeping XRP Capped at $1.10
In the latest XRP News, XRP price is trading at $1.07, down 0.57% in the last 24 hours, as the asset continues to wrestle with the...
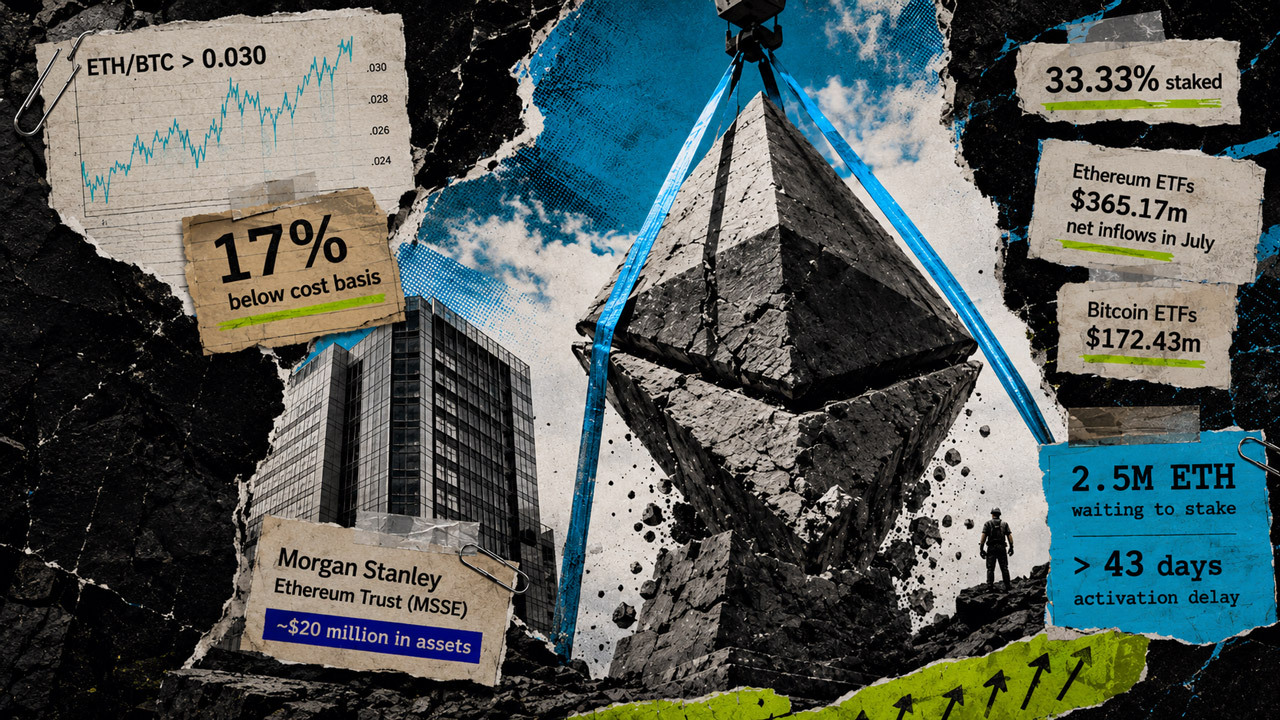
Ethereum just outpaced Bitcoin with $365 million in ETF inflows, but on-chain data shows the real bottom isn’t in yet
Ethereum outpaced Bitcoin in July as stronger investment-product demand and corporate accumulation powered its first sustained rel...