8 Green Candles: Here’s What Happened To Bitcoin The Last Time It Appeared
Bitcoin is on an impressive run and finally broke above $40,000 for the first time in over a year. This run has been in the making for a few months with the climax coming between the months of October and December. As a...
Archive context
Older archive item. Useful for background and entity history, but not a fresh market-moving signal.

Bitcoin is on an impressive run and finally broke above $40,000 for the first time in over a year. This run has been in the making for a few months with the climax coming between the months of October and December. As a result, Bitcoin has now recorded 8 green candles on the weekly chart and historical performance suggests that this is bullish for the price.
8 Green Candles For BTC On The Weekly ChartIn the last two months, the Bitcoin price has consistently closed in the green, a trend that seemed foreign only a few months ago. This green trend has continued through November which was expected to be a bearish month and with the start of December, Bitcoin saw another green weekly close.
During this time that the BTC price has seen consistent green closes on the weekly chart, the price has gone from as low as $27,000 to as high as $42,000. This means that the price has risen approximately 50%, adding around $15,000 to its value in this two-month period.
This comes amid a time of polarizing views between the bulls and the bears despite the bullish indicators continuously winning out. The gains of the last eight weeks have completely washed out a year of intense bearish headwinds and have seen the Bitcoin price completely recover all its losses from the FTX collapse, as well as its far-reaching contagion.
What Happens To Bitcoin The Last Time?With Bitcoin, historical performance can often be a good pointer to future performance, especially when important trends are being repeated. For example, the last time that the digital asset confirmed 8 green candles on the weekly chart, the price exploded not too long after.
This is seen back in 2017 right at the start of the bull market where the price went from around $1,100 to $2,900 before a slight pullback. However, once the pullback was over, the price would begin another uptrend that would send Bitcoin above $10,000 for the first time ever.
If this trend were to repeat itself this time around, then a pullback from this level is likely, but not expected to last. The resulting pump from the pullback will likely be the confirmation of the bull market, leading to a new all-time high price.
Bitcoin has also done incredibly well following 8 green candles on the daily charts. As reported by NewBTC, the Bitcoin price has also risen quickly when these green candles appear. As such, it is an all-around bullish signal for Bitcoin.
Why this matters
This bitcoin story adds another data point to the current market tape and is useful when read alongside nearby source coverage.
Original source
Read on NewsBTCRelated market context

Bitcoin (BTC) Price Prediction: $65K Remains Key Resistance as 4-Year Cycle Model Signals Make-or-Break Moment
The Bitcoin price today remains around $62,600-$62,900, according to TradingView data, reflecting a market that has stabilized fol...
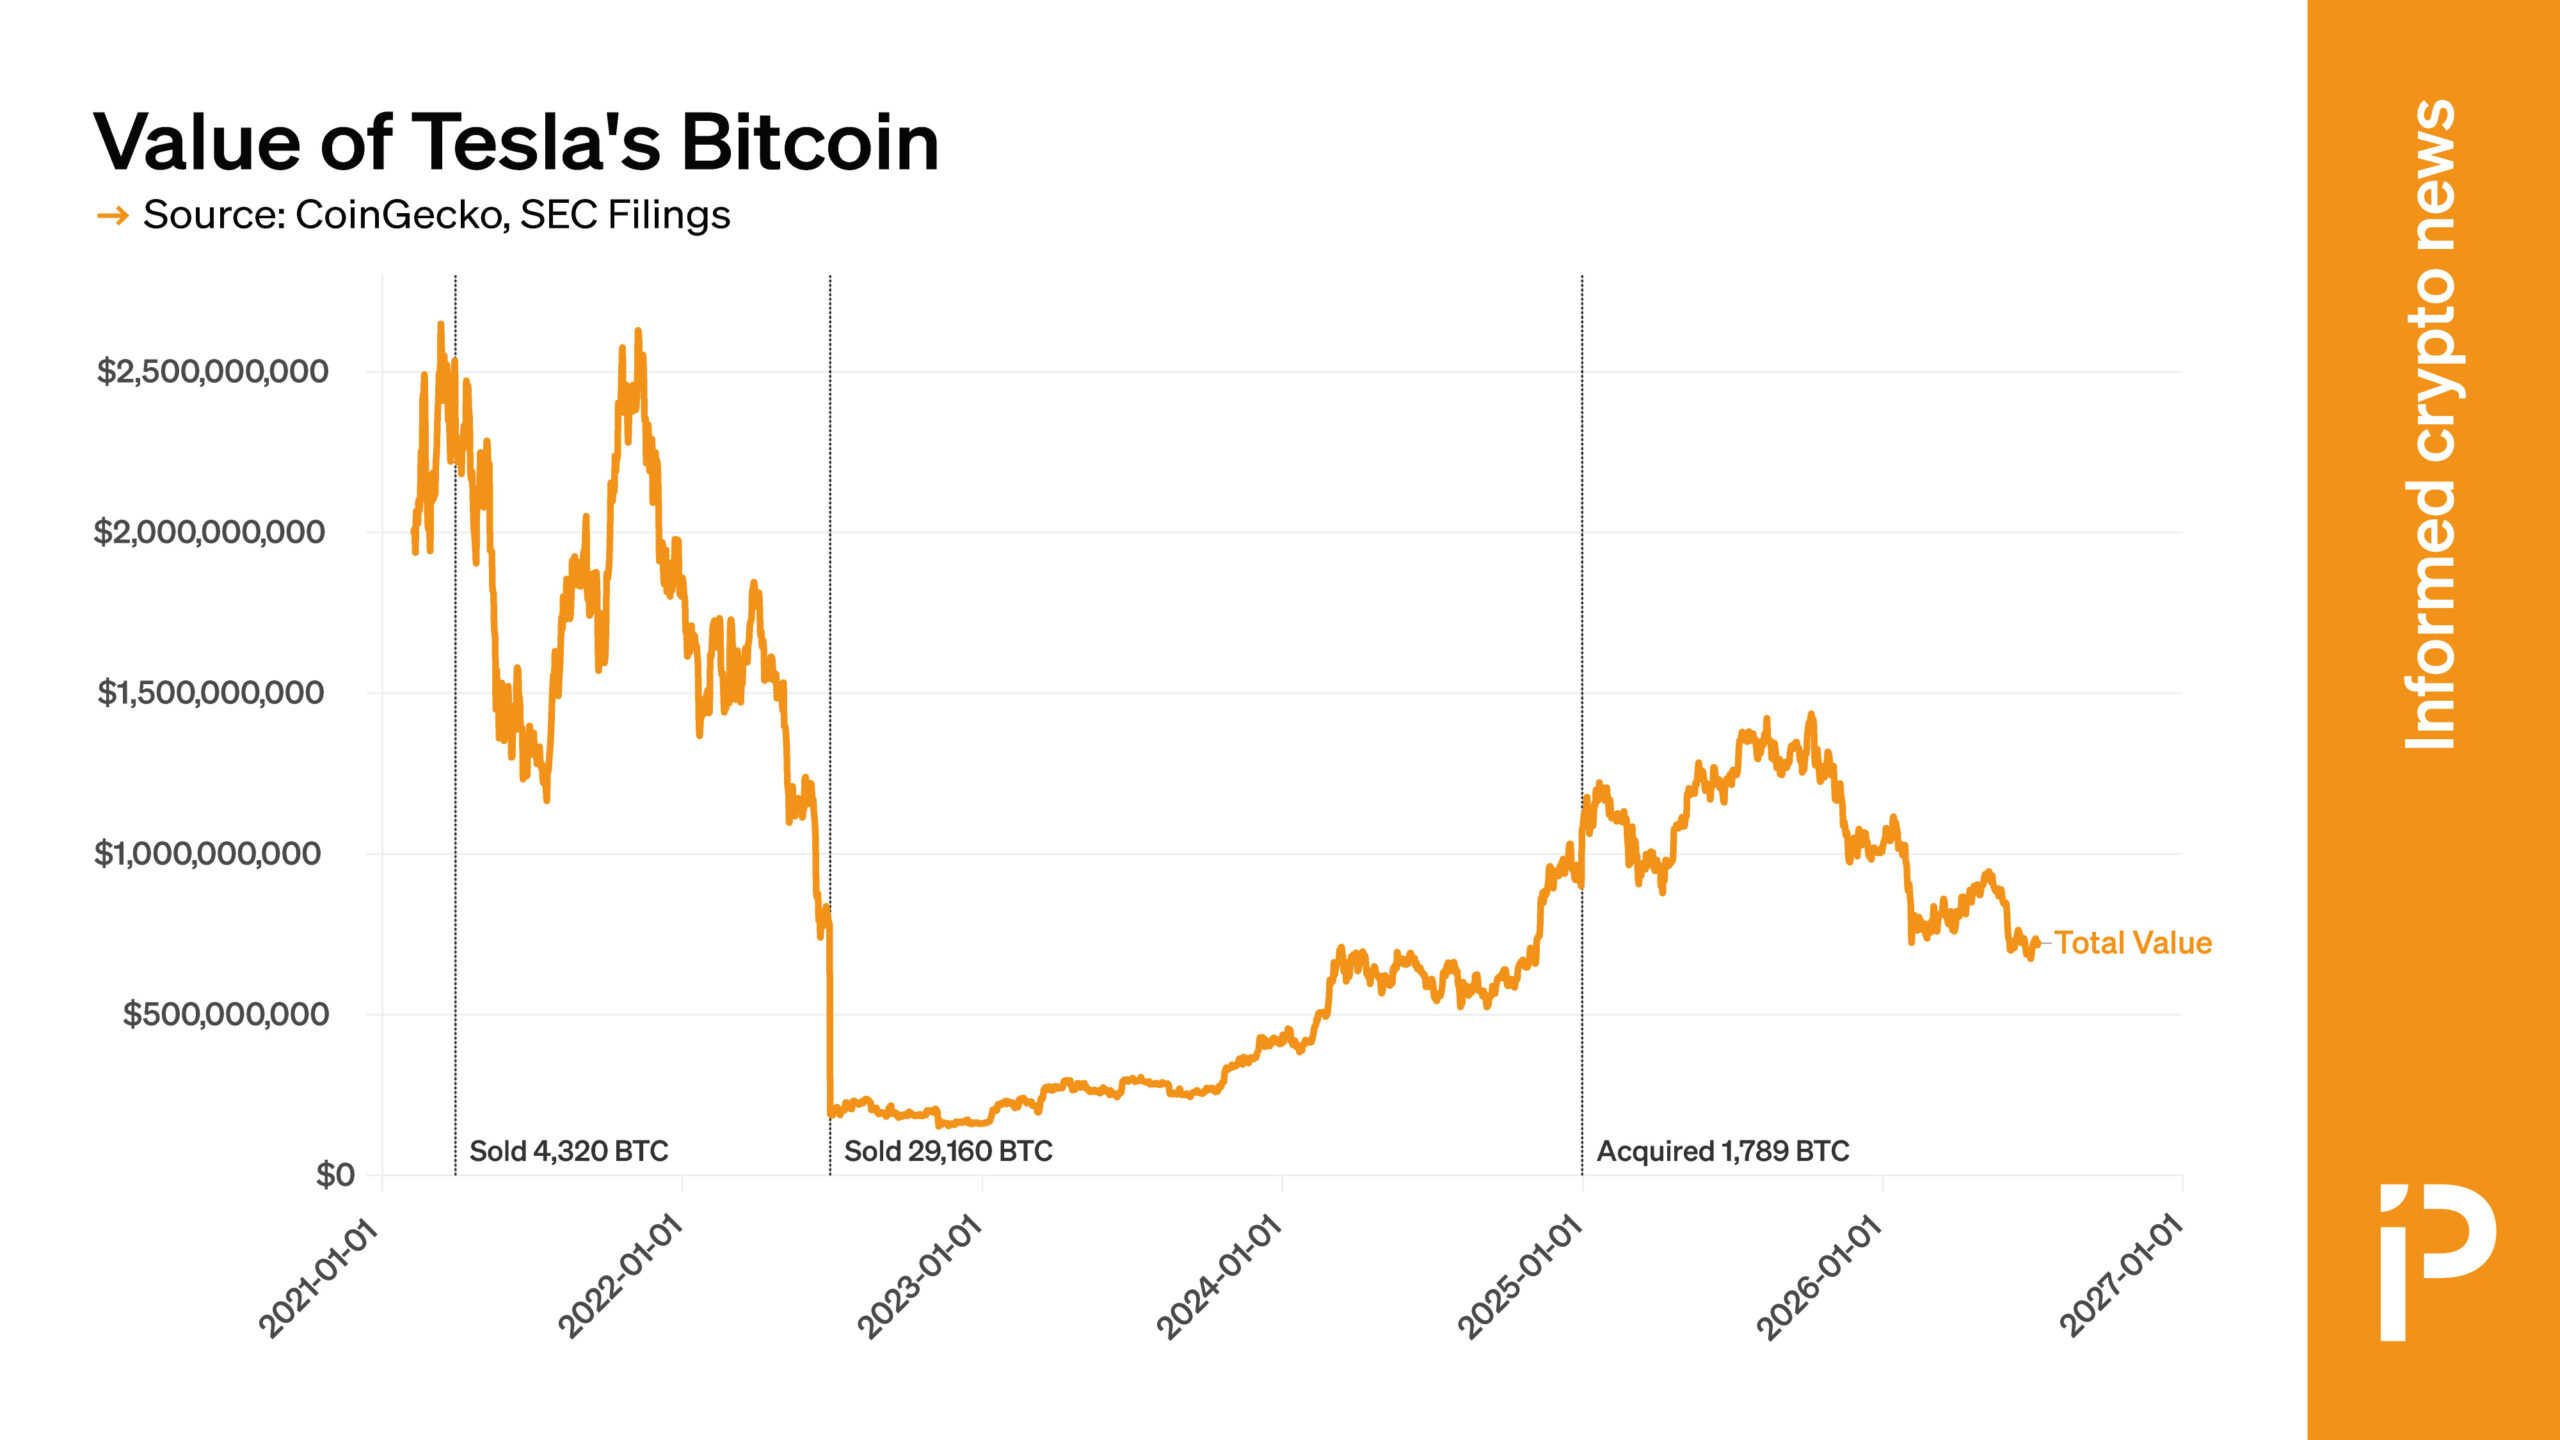
CHART: Value of Tesla’s BTC holdings have fallen by two-thirds
Tesla became one of the early firms to embrace BTC, adding it to its balance sheet in 2021; however, it all but abandoned this ini...

Crypto News, July 9: Iran Market Fears Fade as Bitcoin and Ethereum Price Shrug Off Another Panic
Fresh Iran headlines sent us scrambling last night, but the panic did not last. Markets, especially Bitcoin and Ethereum price, so...
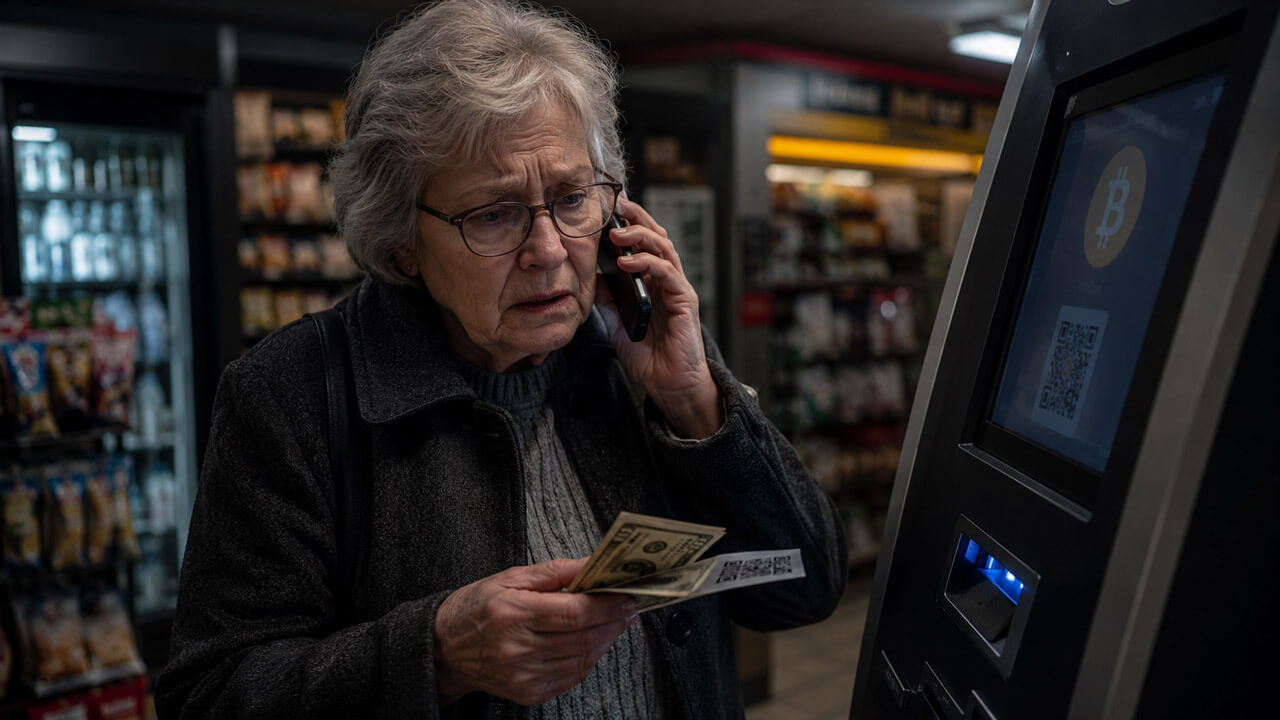
Why Bitcoin ATMs are becoming the last stop in America’s $11B crypto scam pipeline
Crypto scams start online with a fake bank alert, a cloned voice, a romance message, or a tech-support pop-up. Then, the last inst...

Ethereum Price Prediction: Hoskinson Accuses ETH of Taking Cardano Ideas Without Credit
Ethereum price has slipped as fresh ecosystem drama landed, which may bring its prediction down. All the while, buyers tried to de...

Bitcoin Slips to $62,000, Paring Rebound as CryptoQuant Sees Room Higher
Bitcoin Magazine Bitcoin Slips to $62,000, Paring Rebound as CryptoQuant Sees Room Higher Bitcoin traded near $62,000 today, surre...