A Key Bitcoin Signal Is Quietly Building While The Price Stays Flat: Here Is What to Watch Next
Bitcoin is struggling to reclaim $70,000. The price chart is uninspiring. And beneath it, the participants with the longest time horizons and the strongest historical track record are buying more aggressively than they h...

Bitcoin is struggling to reclaim $70,000. The price chart is uninspiring. And beneath it, the participants with the longest time horizons and the strongest historical track record are buying more aggressively than they have in months.
A CryptoQuant report has identified a divergence that separates what the price is doing from what the market’s most conviction-driven participants are doing. Demand from accumulator addresses — wallets that historically only receive Bitcoin and never send it, representing the deepest form of long-term holding conviction — is rising sharply. The spot price, meanwhile, has not returned to its previous major high zone. These two data points are moving in opposite directions simultaneously.
That divergence is the signal. When long-term wallets absorb supply aggressively while price remains suppressed, it suggests that the available sell-side supply is being quietly consumed by participants who are not concerned with where the price is today. They are positioning for where it will be later — and they are doing it faster than the current price action reflects.
Bitcoin at $70,000 looks like resistance. The accumulator data describes it differently — as a price level where the most patient capital in the market has decided the risk is worth taking.
The Signal Is Real. The Confirmation Is Not Yet.The report is precise about what the accumulator divergence means and — equally important — what it does not. A sharp rise in demand from long-term wallets while the price remains below its previous major high is a constructive development in market structure. It is not a breakout signal. It is the precondition for one, and the distinction between those two things is where most market participants make their most expensive mistakes.
What makes the current reading meaningful is the direction of the demand. What makes it insufficient as a standalone signal is the absence of price confirmation. The report identifies the specific condition that elevates the accumulator signal from suggestive to convincing: the 30-day moving average of the metric must continue trending upward, and it must do so alongside price, establishing genuine acceptance at higher levels. One without the other is incomplete. Both together constitute a materially stronger case.
The medium-term structural picture is improving. That is the honest assessment the data supports — not a new trend, not a confirmed breakout, but a foundation that is being quietly reinforced by the most patient capital in the market.
Foundations do not guarantee buildings. They make them possible. Bitcoin’s accumulator data is lying one. The price has not yet been decided to build on it.
Bitcoin Stalls Below Resistance as Range Structure TightensBitcoin is consolidating near $68,400, but the broader daily structure remains intact: this is a recovery within a downtrend, not a confirmed reversal. Price continues to trade below the 50, 100, and 200-day moving averages, all of which are trending downward and acting as dynamic resistance layers above.
The February sell-off remains the defining structural break. Bitcoin lost the $90,000–$95,000 region and accelerated into a capitulation move toward $60,000, accompanied by a clear spike in volume. That event reset positioning and established the current trading range between approximately $62,000 and $72,000.
Since then, price action has tightened. The recent bounce toward $72,000 failed to hold, producing another lower high. Now, Bitcoin is compressing closer to the midpoint of the range, with volatility declining and volume normalizing. This type of contraction typically precedes expansion, but direction is not yet resolved.
There is a structural detail worth noting: repeated failures near the 50-day moving average suggest sellers remain active on rallies. Until that level is reclaimed, upside attempts should be treated cautiously.
A breakout above $72,000 would shift short-term momentum and open the path higher. A breakdown below $62,000 would likely trigger another wave of downside continuation.
Featured image from ChatGPT, chart from TradingView.com
Original source
Read on NewsBTCRelated market context

Bitcoin price faces new risk as big buyers lose conviction
Bitcoin’s largest buyers are no longer behaving like a reliable backstop for the largest cryptocurrency. The exchange-traded funds...

Most Traders Will Scroll Past This Grok AI Bitcoin Predicts, Big Mistake
Elon Musk Grok AI just looked at a Bitcoin chart down more than 50% and predicts it’s a classic accumulation zone, targeting $150,...

XRP aims for $0.90 as ETF demand battles selling pressure from whales
XRP is trading at $1.11, down roughly 17% from its June opening, having set a new 2026 low on June 5 and shed $8 billion in market...
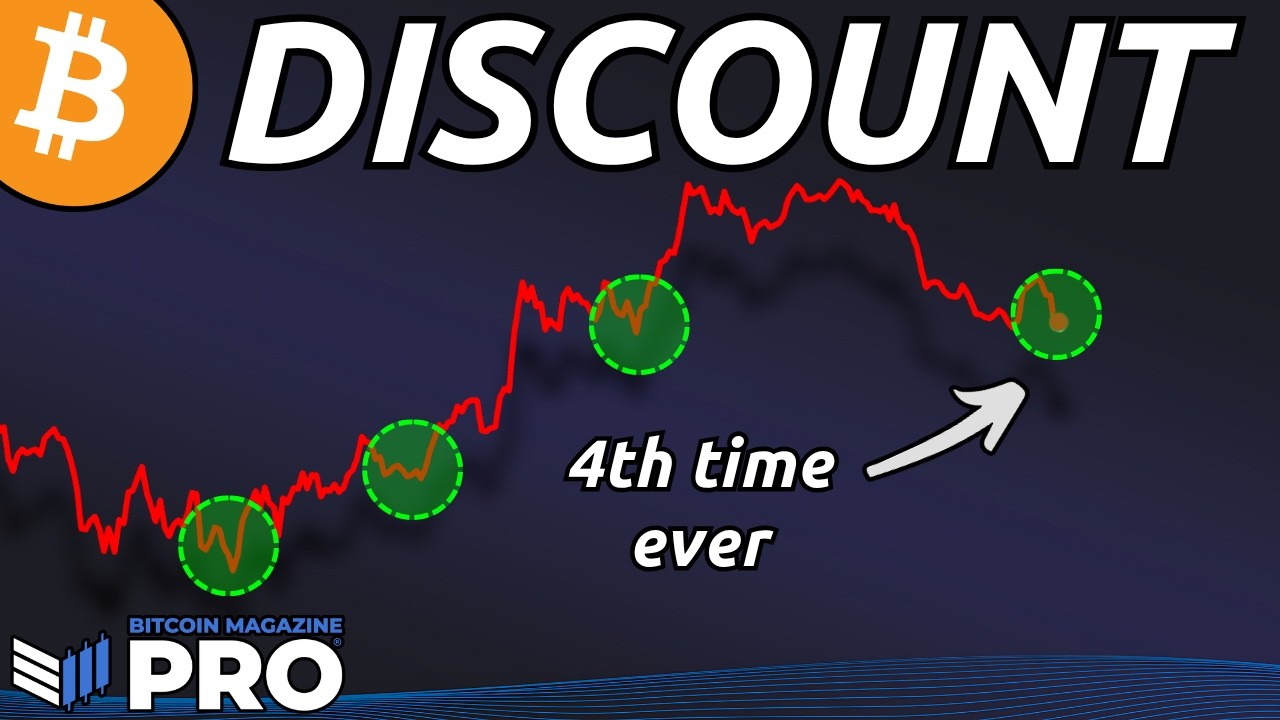
Strategy Stock MSTR Offers Bitcoin Exposure At 18% Discount
Bitcoin Magazine Strategy Stock MSTR Offers Bitcoin Exposure At 18% Discount I’ve been vocal about accumulating Bitcoin aggressive...

Crypto exchanges are opening a two-front war for the stock market
Binance, Kraken, Bybit, and Gemini are moving to add US stocks and ETFs to their crypto trading apps, making a direct play for the...

Elon Musk’s SpaceX IPO fever sparks $1 billion crypto bet before Nasdaq debut
Crypto traders have turned Elon Musk’s expected SpaceX listing into a round-the-clock proxy market, pushing more than $1 billion t...