Bitcoin breaks $86K as US tariff 'Liberation Day' risks 11% BTC price dip
Bitcoin (BTC) reached new April highs at the April 2 Wall Street open as markets braced for US “Liberation Day.”BTC/USD 1-hour chart. Source: Cointelegraph/TradingViewBitcoin teases breakout in US tariff countdownData fr...
Archive context
Older archive item. Useful for background and entity history, but not a fresh market-moving signal.

Bitcoin (BTC) reached new April highs at the April 2 Wall Street open as markets braced for US “Liberation Day.”
BTC/USD 1-hour chart. Source: Cointelegraph/TradingView
Bitcoin teases breakout in US tariff countdownData from Cointelegraph Markets Pro and TradingView showed local highs of $86,444 on Bitstamp, the best performance for BTC/USD since March 28.
Volatility remained in the run-up to US President Donald Trump announcing a sweeping round of reciprocal trade tariffs.
The measures would be unveiled in an address from the White House Rose Garden at 4 pm Eastern Time, with Trump then holding a press conference.
While US stocks traded slightly down after the open, Bitcoin managed to claw back lost ground, acting in a key area of interest filled with long-term trend lines.
As Cointelegraph reported, these include various simple (SMA) and exponential (EMA) moving averages, among them the 200-day SMA — a classic bull market support line currently lost.
BTC/USD 1-day chart with 200 SMA. Source: Cointelegraph/TradingView
In his latest observations, popular trader and analyst Rekt Capital made additional reference to the 21-week and 50-week EMAs.
“The consolidation between the two Bull Market EMAs continues. However, the 21-week EMA (green) represents lower prices as it declines,” he wrote in a post on X alongside an illustrative chart.
“This week the green EMA represents $87650. The declining nature of this EMA will make it easier for $BTC to breakout.”BTC/USD 1-week chart with 21, 50 EMA. Source: Rekt Capital/X
Rekt Capital flagged more bullish news in the making, thanks to BTC/USD attempting to break out of an extended downtrend on daily timeframes.
He confirmed:
“Bitcoin is one Daily Candle Close above & retest of the Downtrend away from breaking out into a new technical uptrend.”BTC/USD 1-day chart. Source: Rekt Capital/X
Last month, Bitcoin’s daily relative strength index (RSI) metric broke free from its own downtrend that had been in place since November 2024.
Analysis warns $76,000 BTC price may returnContinuing on the macro picture, however, trading firm QCP Capital was uninspired.
Related: Bitcoin sales at $109K all-time high 'significantly below' cycle tops — Glassnode
Risk assets, it told Telegram channel subscribers on the day, were likely to “remain under pressure” following the tariffs announcement.
“In crypto, sentiment remains broadly subdued. BTC continues to trade without conviction, while ETH is holding the line at $1,800 support. Across the board, crypto markets are showing signs of exhaustion with numerous coins down 90% YTD, with some shedding over 30% in the past week,” it summarized.
“Without a material shift in macro or a compelling catalyst, we don't expect a meaningful reversal. While light positioning could support a grind higher, we're not chasing any upside moves until the broader macro picture improves.”Previous tariff moves in Q1 almost unanimously delivered downward BTC price reactions.
Other industry participants were more hopeful, including asset management firm Swissblock, which argued that “no sign of an imminent collapse” occurred on Bitcoin.
“Will $BTC hold as a hedge, or follow TradFi into a pullback?” it queried in an X thread on March 31, describing BTC price action as being “at a crossroads.”
Bitcoin price momentum chart. Source: Swissblock/X
Swissblock saw the potential for a return to $76,000 multimonth lows in the event of a negative reaction — a drop of 11% versus current levels.
This article does not contain investment advice or recommendations. Every investment and trading move involves risk, and readers should conduct their own research when making a decision.
Why this matters
This bitcoin story adds another data point to the current market tape and is useful when read alongside nearby source coverage.
Original source
Read on CointelegraphRelated market context
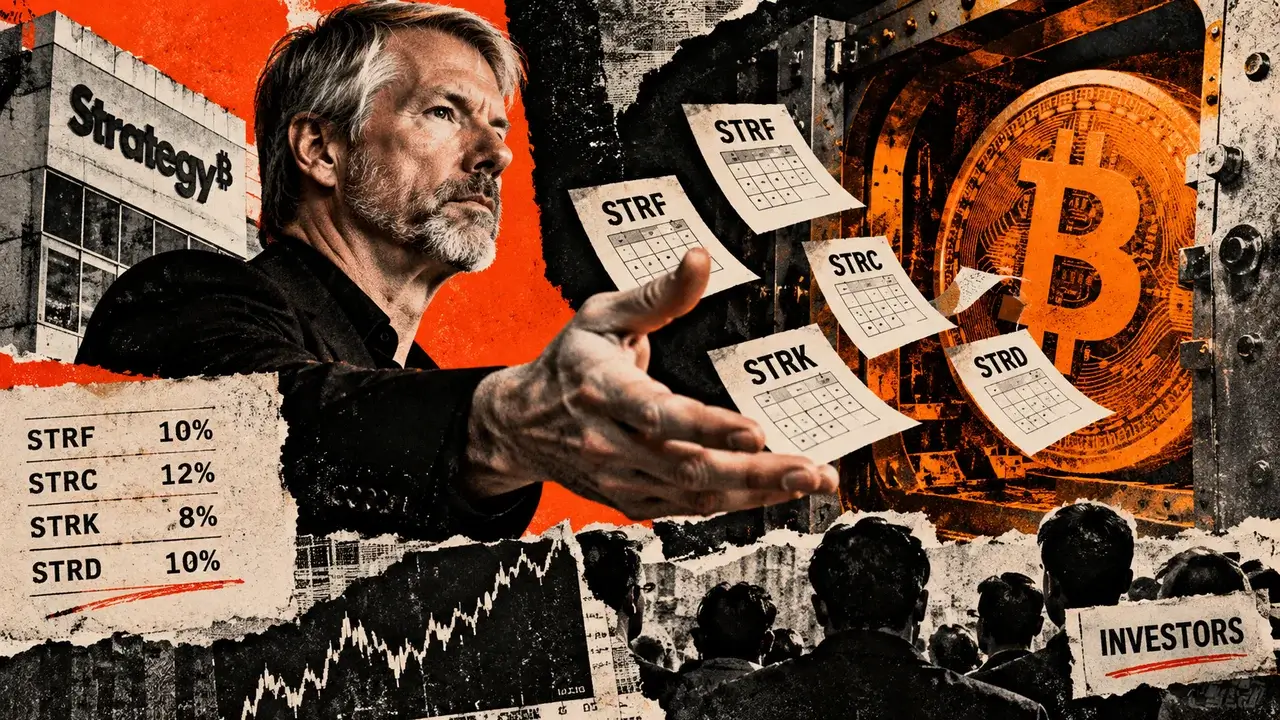
Strategy’s daily dividend proposal puts Bitcoin funding back in investors’ hands
The @saylor account said Friday that Strategy wants to pay dividends daily on four of the preferred shares it uses in its Bitcoin...

Bitcoin Treasury Strategy Proposes Daily Dividends For Preferred Stocks
Bitcoin Magazine Bitcoin Treasury Strategy Proposes Daily Dividends For Preferred Stocks Bitcoin treasury company Strategy wants t...

Quant Crypto Blasts 3x in a Week Following Huge US Bank Deal
Quant crypto has exploded roughly +178% over the last seven days, including an extraordinary +72% daily surge. Quant is quickly be...

Elon Musk Grok AI Predicts a Bold Move for Ethereum in 2026
When prompted, the Elon Musk-backed Grok AI predicts a bold move for Ethereum (ETH) over the remainder of 2026. It claims that if...

Strategy Seeks Shareholder Vote to Pay Daily Dividends on STRC and Three Other Preferreds
Strategy is asking its shareholders to approve daily dividends on its four U.S.-listed preferred stocks, STRF, STRC, STRK and STRD...

US crypto ETFs draw over $3 billion this week, with nearly $800 million flowing beyond Bitcoin
US crypto exchange-traded funds have pulled in more than $3 billion this week as fresh demand spread beyond Bitcoin into Ethereum...