Bitcoin (BTC) Price Prediction: Bitcoin Struggles at $60K as MSTR Drawdown and Weak Demand Keep Bulls on Edge
While long-term analysts continue to point to the 200-week Simple Moving Average (SMA) as a key accumulation area, persistent selling activity and renewed debate surrounding Strategy’s (MSTR) leveraged Bitcoin strategy h...
Archive context
Older archive item. Useful for background and entity history, but not a fresh market-moving signal.

While long-term analysts continue to point to the 200-week Simple Moving Average (SMA) as a key accumulation area, persistent selling activity and renewed debate surrounding Strategy’s (MSTR) leveraged Bitcoin strategy have kept sentiment cautious.
At the time of writing, Bitcoin price today is trading near $60,157, according to TradingView, as investors evaluate whether the latest correction is nearing exhaustion or whether additional downside remains possible.
Bitcoin price prediction hinges on long-term supportOne of the most closely watched long-term indicators has returned to the spotlight. Market analyst Ali Martinez highlighted that Bitcoin has historically spent very little time below its 200-week Simple Moving Average, a level that has repeatedly acted as a foundation during previous bear markets.
Bitcoin has historically found strong long-term support near its 200-week SMA, with previous tests often marking favorable accumulation opportunities. Source: Ali Martinez via X
The indicator currently sits around $59,560, placing the BTC price only slightly above a support area that has historically marked attractive long-term accumulation zones. Similar recoveries developed after Bitcoin tested this moving average during the 2020 and 2022 market cycles.
Martinez noted that investors have often used this area for dollar-cost averaging rather than attempting to perfectly time a market bottom. While the historical record favors patience around the 200-week SMA, the analyst also emphasized that it should be evaluated alongside broader market conditions, including liquidity, macroeconomic trends, regulatory developments, and on-chain data.
The current environment differs from previous cycles because Bitcoin remains in a corrective phase following record highs, making confirmation from multiple indicators increasingly important.
Weak Bitcoin demand continues to weigh on market sentimentAlthough long-term support remains intact, on-chain data suggests that buying demand has yet to recover.
According to CryptoQuant data shared by Ali Martinez, Bitcoin’s Apparent Demand has remained negative for 208 consecutive days, recently falling to approximately -273,000 BTC.
Bitcoin’s apparent demand has remained negative for 208 consecutive days, falling to a cycle low of approximately -273,000 BTC, signaling persistent selling pressure. Source: @alicharts via X
The metric compares newly mined Bitcoin entering circulation with the movement of existing coins. Extended periods of negative readings indicate that older coins are entering the market faster than fresh demand can absorb them, creating persistent selling pressure.
The recent decline marks one of the weakest demand readings of the current cycle and suggests that supply continues to outweigh new capital entering the market.
When asked who has been selling despite reports of limited long-term holder distribution, Martinez responded, “Everybody and their mothers have been selling.”
While the comment was made informally, the data illustrate that distribution remains broad enough to limit sustained upside until stronger demand returns.
MSTR drawdown fuels fresh debate over leveraged Bitcoin exposureMarket discussion has also shifted toward Strategy (formerly MicroStrategy) after a widely circulated satirical chart highlighted the company’s significant share price decline from its all-time high.
A satirical chart highlighted MSTR trading about 84.9% below its all-time high, using fictional comparison securities to criticize the risks of Strategy’s heavily leveraged Bitcoin investment approach. Source: Ali Martinez via X
The illustration showed MSTR down roughly 84.9% from its peak while comparing its performance with several fictional securities. Although the graphic was not intended as a formal financial analysis, it reignited criticism of the company’s highly leveraged Bitcoin acquisition strategy.
The discussion intensified after Ripple CEO Brad Garlinghouse criticized Strategy’s financing model during a CNBC interview.
Garlinghouse argued that relying on debt and preferred stock offerings to accumulate Bitcoin increases downside risk during market corrections and can amplify volatility across the broader crypto market.
Ripple CEO Brad Garlinghouse said Strategy’s debt-funded Bitcoin purchases have amplified selloffs and increased crypto market volatility. Source: @cryptogoos via X
At the same time, he reaffirmed his positive long-term view on Bitcoin, describing it as “digital gold” while arguing that lasting value in digital assets ultimately comes from real-world utility and adoption rather than financial engineering.
The remarks generated mixed reactions across the crypto community, with supporters of Strategy defending the company’s transparent corporate treasury model while others questioned whether heavy leverage increases systemic risk during prolonged market downturns.
Bitcoin technical analysis shows bears still control the trendTradingView’s latest technical indicators continue to favor sellers despite signs that momentum may be stabilizing.
The overall technical summary remains neutral, although the underlying readings reveal 14 sell, 8 neutral, and 4 buy signals.
Oscillators paint a mixed picture. The Relative Strength Index (RSI-14) stands at 33, approaching oversold territory without yet confirming a reversal. Stochastic %K reads 22, while Williams %R sits at -77, both indicating weakening momentum rather than outright capitulation.
Bitcoin (BTC) was trading at around $60,129, down 0.39% in the last 24 hours at press time. Source: Bitcoin price via Brave New Coin
Some momentum indicators have started flashing early buy signals. The Commodity Channel Index (CCI-20) is at -120, Momentum (10) stands at -2,740, and Stochastic RSI Fast reads 13, suggesting short-term selling pressure may be becoming overstretched.
However, bearish momentum has not disappeared. The MACD (12,26) remains on a sell signal at approximately -2,310, while the ADX is near 36; the Awesome Oscillator, Bull Bear Power, and the Ultimate Oscillator remain largely neutral.
Moving averages present an even more cautious outlook. Bitcoin continues to trade below nearly every major moving average, including the 10-day EMA ($61,468), 20-day EMA ($63,107), 50-day EMA ($67,219), and 200-day EMA ($76,688). The Hull Moving Average near $59,057 remains one of the few indicators still signaling a potential bullish divergence, while the Ichimoku Base Line around $62,727 serves as nearby resistance.
Taken together, the technical picture suggests that Bitcoin price prediction remains dependent on whether buyers can reclaim resistance around the low-$60,000 region while preventing a sustained break below the historically important 200-week SMA.
For now, long-term support continues to attract attention, but persistent distribution, cautious institutional sentiment, and overwhelmingly bearish moving averages indicate that bulls still need stronger evidence before a durable recovery can take shape.
Why this matters
Bitcoin is showing up inside the Institutional Adoption theme, so this story is worth tracking for follow-through rather than treating it as a one-off headline.
Original source
Read on Brave New CoinRelated market context
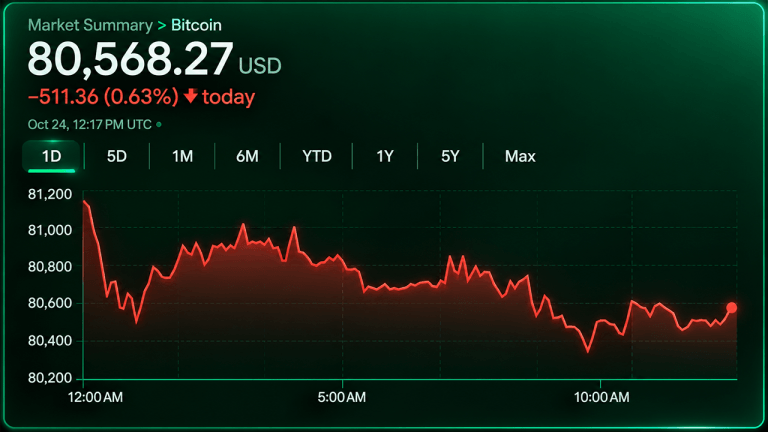
Bitcoin Price Faces $78K Threat as Sellers Hammer Key Support
Bitcoin’s price traded near $80,500 Saturday morning, Oct. 24, with sellers controlling the shorter time frames despite longer-ter...

Ether ETFs Are Having Their Worst Month of 2026. Who Buys Once Bitmine Stops?
Ether’s (ETH) demand this year has largely come from two places: spot exchange-traded funds (ETFs) and Bitmine Immersion Technolog...
Dune Adds Real-Time Spot And Perpetual Trade Feeds Across On-Chain Markets
TL;DR: Dune has launched normalized real-time feeds for spot and perpetual DEX trades, designed to help institutional desks compar...

OpenAI faces financial scrutiny amid reduced valuation and discounting strategy
OpenAI's financial strategies and valuation adjustments may signal deeper liquidity issues, raising concerns about its long-term v...

Ethereum (ETH) Price Prediction: Whale Rotates $155M Into ETH as Longs Surge Near $2,500
Ethereum is trying to stabilize after another volatile stretch, with price returning toward the mid-$2,400 region while several po...

KBC Group adds roughly $5.9 million in Strategy shares to its Bitcoin bet
KBC's investment strategy highlights growing institutional interest in crypto, but also underscores the risks of concentrated expo...