Bitcoin (BTC) Price Prediction: Where Could Bitcoin Head This Week if Bulls Defend the $112K Support?
As the Bitcoin price today hovers around the $114K mark, investors and traders alike are closely watching whether BTC can maintain this level and stage a renewed rally. With optimism growing around spot ETF activity, wha...
Archive context
Older archive item. Useful for background and entity history, but not a fresh market-moving signal.

As the Bitcoin price today hovers around the $114K mark, investors and traders alike are closely watching whether BTC can maintain this level and stage a renewed rally. With optimism growing around spot ETF activity, whale accumulation, and declining miner selling pressure, this week could mark a critical pivot for the flagship crypto.
Bitcoin Technical Analysis: Market Overview and Key Chart SignalsBitcoin is currently trading at $114,118, up 0.38% over the past 24 hours. The price action shows BTC is bouncing off the $112K support zone, which aligns with the 20-day EMA and mid-range of a rising parallel channel on the 4H chart.
Bitcoin is showing a potential bullish reversal near the $112,000 support with a 4-hour Gartley pattern, suggesting a possible buy opportunity. Source: EdwinaCook on TradingView
According to recent Bitcoin technical analysis, the Relative Strength Index (RSI) on the daily chart remains neutral at 54, leaving plenty of room for further upside. Momentum is turning positive again, following a brief cooling-off period after BTC hit a new cycle high at $123,500 in July.
A bullish divergence between price and the Bitcoin RSI indicator suggests that buyers could be regaining control. If BTC reclaims $116,000 this week, a push toward $120K and eventually a retest of the $123K zone could be on the table. On the downside, losing $112K may expose Bitcoin to a correction toward the 50-day MA near $108,800.
Bitcoin News Today: Halving, ETF Inflows, and Whale Accumulation in FocusOne of the key catalysts behind recent Bitcoin strength is the resurgence in Bitcoin ETF news, with U.S.-based spot ETFs seeing renewed inflows after a brief outflow period in mid-July. According to Glassnode, net inflows have picked up again, signaling institutional confidence remains intact despite recent market volatility.
BTC: US Spot ETF Net Flows chart. Source: Glassnode
Meanwhile, on-chain data shows a steady increase in Bitcoin whale alert activity. Large wallets (holding 1,000+ BTC) have accumulated over 45,000 BTC over the past two weeks, coinciding with BTC’s defense of the $112K level.
In addition, the upcoming Bitcoin halving 2025, now just eight months away, is reigniting bullish long-term sentiment. Historically, BTC tends to enter a strong accumulation phase 6–12 months before a halving event—2020 and 2016 halving cycles both support this trend.
Whale behavior, ETF buying, and miner supply tightening ahead of the halving are combining to form a strong bullish foundation for BTC.
Expert Insights: Is Bitcoin Still an Inflation Hedge?Analysts remain optimistic about Bitcoin’s macro-outlook, with many continuing to view BTC as a viable inflation hedge, especially in light of mounting sovereign debt and slowing global growth.
JP Morgan’s Q3 crypto report noted that BTC vs ETH for Q3 2025 favors Bitcoin due to its more predictable monetary policy and higher institutional adoption through ETFs. Furthermore, recent comments from BlackRock’s Larry Fink suggest that Bitcoin’s role as digital gold is becoming more established—particularly after the Bitcoin ETF approval by the SEC earlier this year.
Bitcoin (BTC) was trading at around $114,118, up 0.38% in the last 24 hours at press time. Source: Bitcoin Liquid Index (BLX) via Brave New Coin
On the tech side, the Bitcoin Taproot upgrade and scaling solutions like the Lightning Network continue to make the Bitcoin network more efficient and suitable for broader adoption. Combined with declining Bitcoin miner revenue—a trend that often precedes price rallies due to reduced sell pressure—the macro case for BTC remains strong.
Looking Ahead: BTC’s Next Move and Long-Term OutlookIf bulls continue to hold the line above $112,000, Bitcoin appears poised for another leg up toward $120K–$123K in the near term. A breakout above that zone could open the door for a new 2025 high and potentially push BTC closer to $130K before the end of Q3.
In the broader context, momentum from ETF flows, halving expectations, and institutional narratives could strengthen Bitcoin’s positioning as a long-term store of value.
For traders and investors alike, this week’s battle around the $112K zone could be pivotal in shaping Bitcoin’s next move—and may provide key signals for the Bitcoin long-term outlook heading into the final quarter of 2025.
Why this matters
This bitcoin story adds another data point to the current market tape and is useful when read alongside nearby source coverage.
Original source
Read on Brave New CoinRelated market context

Hyperliquid (HYPE) Price Prediction: Can Whale Buying and Binance Listing Drive HYPE to $210?
The technical setup for Hyperliquid price currently places $110, $130, $160, and $180 among the key levels to watch, while some tr...

Crypto News Today: XRP, Dogecoin Signal Long-Term MVRV Discounts as Bitcoin Holds $82.5K Neckline
On-chain analytics firm Santiment reported that XRP’s 365-day Market Value to Realized Value (MVRV) stood at approximately -11.75%...

XRP Price Prediction: October is a Weak Month for Ripple, But 3 Metrics Point Bullish
XRP is trading at $1.50, down 7.6% over the past 24 hours after reaching $1.63 during the period. Despite the pullback and a beari...

Microsoft Copilot AI Predicts Bitcoin Will Do Something Incredible in Q4 2026
Microsoft Copilot AI predicts a wild move for BTC in Q4 2026, calling it one of the strongest asymmetric risk-reward positions ava...

XRP Price Under Pressure: Spot Selling Overwhelms ETF Demand
XRP price is hovering at the $1.50 level, down 8% over the prior 24 hours after failing to hold the $1.60 level. The drop happens...
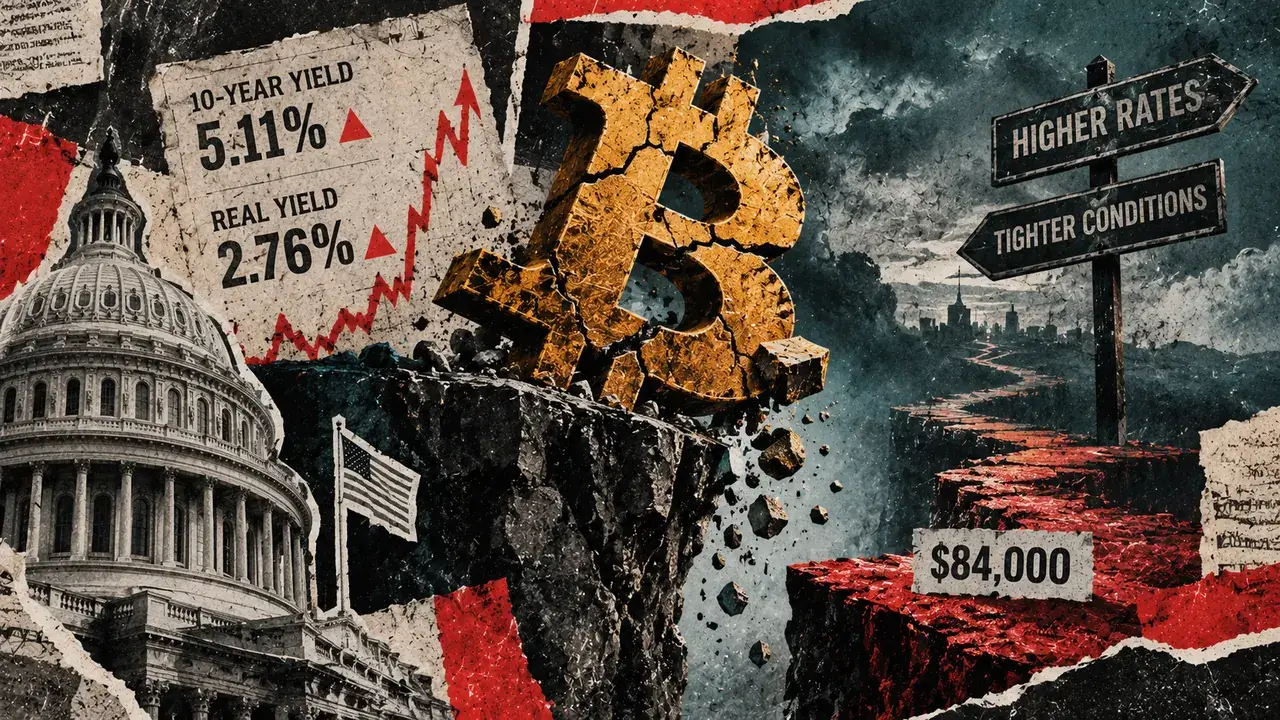
Why surging US real yields are quietly forcing Bitcoin under $84,000
Bitcoin registered an intraday low at $83,500 on Sept. 23, the same day the US 10-year Treasury yield closed at 5.11%, up 15 basis...