Bitcoin Bulls Rely on STH Realized Price Support Cluster: Loss Could Trigger $100K Retest
Bitcoin is once again under heavy pressure, sliding toward the $103,000 level as the broader crypto market undergoes a sharp downturn. After days of volatility and failed recovery attempts, BTC has lost key support, trig...
Archive context
Older archive item. Useful for background and entity history, but not a fresh market-moving signal.

Bitcoin is once again under heavy pressure, sliding toward the $103,000 level as the broader crypto market undergoes a sharp downturn. After days of volatility and failed recovery attempts, BTC has lost key support, triggering renewed fear and accelerating sell-offs across altcoins. Most major assets are showing deep losses, with traders and investors now questioning whether the market has entered a deeper corrective phase.
According to top analyst Axel Adler, Bitcoin’s main support zone lies between $106,000 and $107,000, a range defined by the Short-Term Holder (STH) 1M–3M Realized Price and the 200-day simple moving average (SMA 200D). This critical area represents a confluence of both on-chain and technical support levels where previous corrections have historically found equilibrium.
However, the current momentum shows mounting weakness. As panic spreads and liquidity dries up, all eyes are now on the $106K–107K range — a decisive battleground that could define Bitcoin’s short-term trajectory and set the tone for the rest of the crypto market.
Bitcoin’s Market Structure Faces a Crucial TestAdler highlights that a loss of the $106K level would likely trigger a move toward $100,000, where the yearly moving average (SMA 365D) currently aligns — a level that has historically acted as a springboard for major reversals during previous market cycles.
Despite the growing fear, Adler notes that the macro structure remains bullish as long as the $100K base holds. This region represents long-term buyer interest, and defending it could reset overheated leverage and pave the way for a more stable recovery. However, Bitcoin is already trading below the $106K mark, raising concerns that the market could be preparing for a deeper test of this critical floor.
Analysts across the space are now closely watching the daily candle closes, which will determine whether the move below support is merely a liquidity sweep or confirmation of a bearish continuation. If Bitcoin fails to reclaim the $107K level soon, a broader shift in sentiment could unfold — one that may prolong the consolidation phase and test investor conviction.
In contrast, a strong rebound from the $100K zone would reinforce the argument that the correction is part of a healthy reset within an ongoing bull market. The coming days will therefore be decisive: either Bitcoin holds this base and rebuilds momentum, or it breaks lower, signaling that the current cycle’s most aggressive phase of volatility is far from over.
Bitcoin Tests Support Zone Amid Continued WeaknessBitcoin continues to slide, with the latest chart showing price action hovering around $106,000, now testing one of the most critical support zones in months. After failing to reclaim the $115,000 and $117,500 resistance levels earlier this week, BTC extended its losses, touching an intraday low near $103,500 before recovering slightly. The market remains tense as traders watch whether the 200-day moving average (SMA 200D) — currently around $107,500 — will hold.
This level represents the Short-Term Holder (STH) realized price region and coincides with the area identified by analysts as a major structural base. A confirmed breakdown below it could open the door to a test of $100,000, where the yearly moving average (SMA 365D) aligns, serving as the next major support.
Momentum indicators suggest that BTC is still under strong bearish pressure. The 50-day and 100-day moving averages are trending downward, indicating a loss of short-term momentum. Unless Bitcoin can close daily candles back above $107K, market sentiment is likely to remain cautious.
Featured image from ChatGPT, chart from TradingView.com
Why this matters
This bitcoin story adds another data point to the current market tape and is useful when read alongside nearby source coverage.
Original source
Read on NewsBTCRelated market context

XRP Price Today: XRP Hits $1.60 as Heavy Whale Accumulation Points to a $2 Rally and Beyond
The XRP price reached $1.6060 on September 23 after opening near $1.5808, according to historical market data. The token subsequen...

Solana Price Prediction: Golden Cross and $2.97B Open Interest Put $400 Target in Focus
Solana price is trading near $117.38 after recovering strongly from its recent lows. With SOL now testing the crucial $118–$120 re...

Glassnode sees $95K to $97K as Bitcoin’s next major test
Bitcoin could test $95,000 to $97,000 as ETF inflows strengthen, spot volume rises and leverage remains relatively subdued, Glassn...
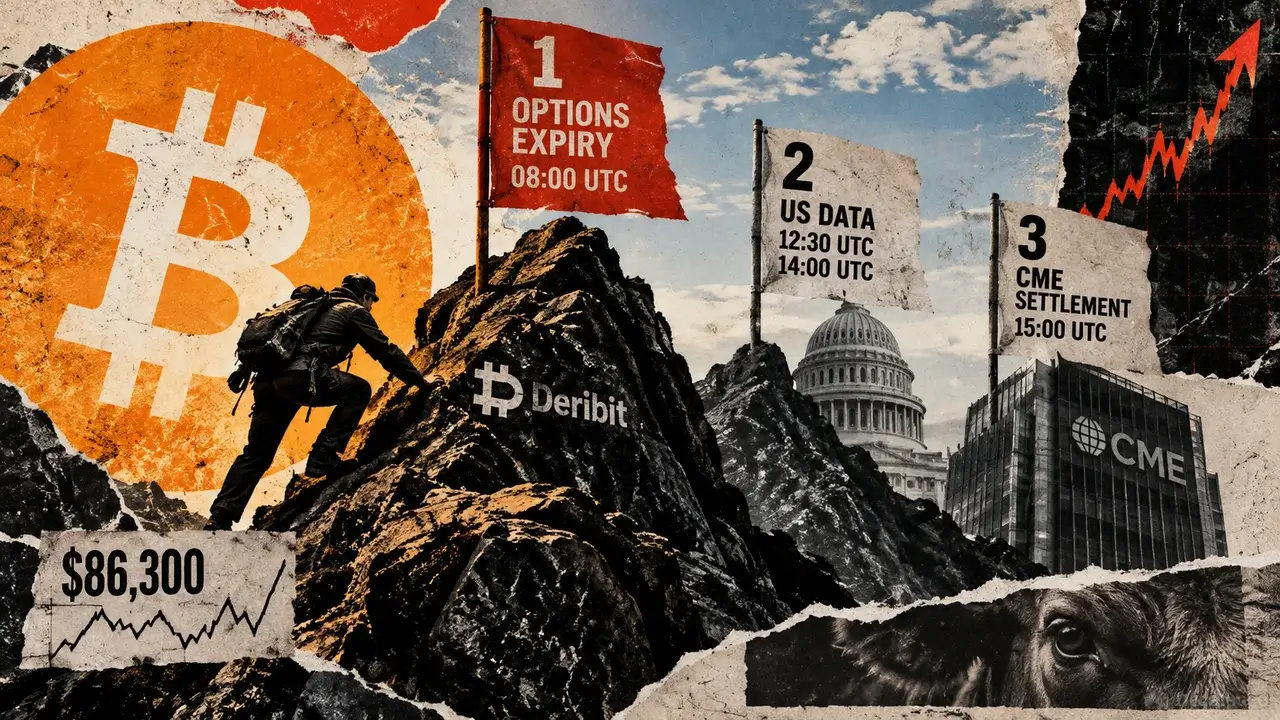
Bitcoin faces $16 billion options expiry Friday, then two more tests hit the rally
Bitcoin options carrying roughly $16 billion in notional value expire on Deribit at 08:00 UTC on Friday, Sept. 25. Calls account f...

Most altcoin holders remain in losses as market recovery lags behind Bitcoin
Altcoin holders face prolonged losses, highlighting the need for utility-driven investments as Bitcoin's dominance continues to ov...

Bitcoin ETFs just erased a $5.7 billion hole, but profit-taking is swallowing the new demand
Bitcoin exchange-traded funds (ETFs) have erased their 2026 flow deficit after a sharp buying revival, even as the top crypto stru...