Bitcoin Dips Again: Temporary Setback or Buying Opportunity?
Bitcoin price started a downside correction from the $71,650 resistance zone. BTC is now consolidating and might correct toward the $69,500 support. Bitcoin struggled above $71,500 and started a downside correction. The...
Archive context
Older archive item. Useful for background and entity history, but not a fresh market-moving signal.

Bitcoin price started a downside correction from the $71,650 resistance zone. BTC is now consolidating and might correct toward the $69,500 support.
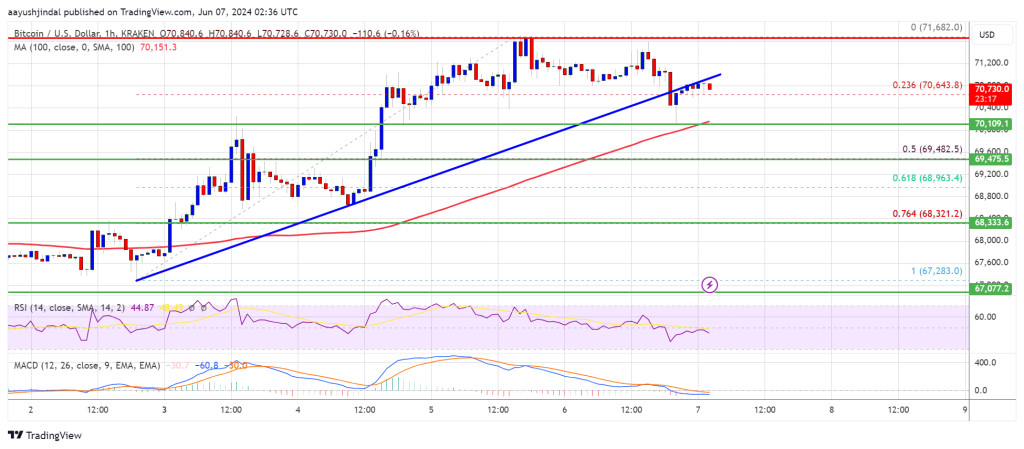
- Bitcoin struggled above $71,500 and started a downside correction.
- The price is trading above $70,000 and the 100 hourly Simple moving average.
- There was a break below a key bullish trend line with support at $70,650 on the hourly chart of the BTC/USD pair (data feed from Kraken).
- The pair could decline further if there is a move below the $70,000 level.
Bitcoin price extended its increase above the $70,000 level. BTC was able to clear the $70,500 and $71,200 levels to move further into a positive zone. However, the bears were active near the $71,650 zone.
A high was formed at $71,682 and the price started a downside correction. The price declined below the 23.6% Fib retracement level of the upward wave from the $67,285 swing low to the $71,682 high. There was also a break below a key bullish trend line with support at $70,650 on the hourly chart of the BTC/USD pair.
The price tested the $70,200 support zone. Bitcoin is now trading above $70,000 and the 100 hourly Simple moving average. On the upside, the price is facing resistance near the $70,800 level.
The first major resistance could be $71,200. The next key resistance could be $71,650. A clear move above the $71,650 resistance might send the price higher. In the stated case, the price could rise and test the $72,000 resistance. Any more gains might send BTC toward the $73,200 resistance.
More Downsides In BTC?If Bitcoin fails to climb above the $71,200 resistance zone, it could continue to move down. Immediate support on the downside is near the $70,200 level.
The first major support is $70,000. The next support is now forming near $69,500 or the 50% Fib retracement level of the upward wave from the $67,285 swing low to the $71,682 high. Any more losses might send the price toward the $68,500 support zone in the near term.
Technical indicators:
Hourly MACD – The MACD is now losing pace in the bullish zone.
Hourly RSI (Relative Strength Index) – The RSI for BTC/USD is now below the 50 level.
Major Support Levels – $70,200, followed by $70,000.
Major Resistance Levels – $71,200, and $71,650.
Why this matters
This bitcoin story adds another data point to the current market tape and is useful when read alongside nearby source coverage.
Original source
Read on NewsBTCRelated market context

XRP Price Prediction: XRP Faces Critical Resistance Near $1.17 Despite Ripple Securing Landmark EU License
While the company secured a full MiCA license that expands its operations across the European Economic Area, market indicators sug...

Bitcoin (BTC) Price Prediction: BTC Holds $63K Support—Can Rising Active Addresses Offset Bearish Technical Signals?
Although the BTC price has remained near a key support zone, recent chart signals and Strategy’s sale of a portion of its Bitcoin...

Bitcoin price rebounds to $63K as leverage returns creating short term volatility risk
Bitcoin's rebound has cleared the first test: price recovered. The harder one starts now: proving buyers remain after the squeeze....

Sui DeFi TVL Breaks $1 Billion As Move-Based Chains Fight For Liquidity
Sui has crossed the $1 billion total value locked mark on DeFiLlama, giving the Move-based network a clearer claim to serious DeFi...

Bitcoin miner bottom signal now depends on who survives weak mining profits
A Bitcoin miner-stress signal circulating on X has fallen into a zone analysts associate with severe miner pressure, putting a fam...

Bitcoin dominance hits one-month low as altcoin winners start breaking away
Bitcoin's dominance dropped to a one-month low of 54%, down from 58.12%, according to CoinGecko's dominance table. Over the same s...