Bitcoin Faces Pressure as Taker Ratio Hits Lowest Level Since Last Cycle’s Peak
Bitcoin (BTC) continues to show signs of weakness after recently setting a new all-time high earlier this month. As of today, the cryptocurrency is trading at $110,595, reflecting a 4.2% decline over the past week and an...
Archive context
Older archive item. Useful for background and entity history, but not a fresh market-moving signal.

Bitcoin (BTC) continues to show signs of weakness after recently setting a new all-time high earlier this month. As of today, the cryptocurrency is trading at $110,595, reflecting a 4.2% decline over the past week and an 11% drop from its peak of $124,000.
The correction highlights an ongoing struggle for momentum even as broader market conditions remain uncertain. This decline has drawn the attention of analysts examining key on-chain and trading metrics.
One such measure is the Taker Buy Sell Ratio, which is signaling reduced confidence among traders. According to data from CryptoQuant, this ratio has fallen to levels not seen since late 2021, raising questions about whether Bitcoin’s recent highs can be sustained without stronger demand.
Bitcoin Taker Buy Sell Ratio Suggests Shift in Market DynamicsCryptoQuant contributor Gaah explained that the 30-day moving average of Bitcoin’s Taker Buy Sell Ratio has dropped to its lowest level since November 2021, a period that coincided with the peak of the previous cycle near $69,000 before a prolonged downturn.
The ratio tracks the balance between aggressive buy and sell orders at market prices. A value above 1 reflects stronger buying pressure, while a reading below 1 indicates more active selling.
Currently, the ratio sits below its historical average, suggesting that selling activity has consistently outpaced buying in recent weeks. This is notable because it follows closely on the heels of Bitcoin establishing new highs, revealing a divergence between price performance and trader sentiment.
Gaah argued that such behavior often signals caution among investors who may be locking in profits or reducing exposure to manage risk.
“The similarity to November 2021 should not be overlooked,” the analyst noted. “Even as Bitcoin pushed higher at that time, underlying market sentiment was deteriorating, which eventually preceded a sharp correction.”
The current data, Gaah added, indicates that although Bitcoin remains in a broader bullish phase, the imbalance between buyers and sellers could introduce heightened volatility in the weeks ahead.
Analyst Sees Mixed Signals in Technical StructureBeyond on-chain metrics, technical analysts are also weighing in on Bitcoin’s current price structure. A market analyst known as Crypto Nova suggested that despite recent weakness, the overall uptrend remains intact.
In a post on X, the analyst highlighted that Bitcoin has been forming higher lows since its recovery began from a low of nearly $15,000 in late 2022, thereby maintaining a long-term bullish pattern.
Nova pointed to the $50,000–$70,000 range from earlier in the cycle as an example of a level many believed to mark the top, but which ultimately gave way to further gains.
The analyst noted that the same uncertainty applies to today’s market, where corrections do not necessarily confirm a cycle peak. “At the very least, BTC should see a bounce from current levels,” Nova said, while also acknowledging that resistance remains strong at higher price zones.
Bounce time for Bitcoin?
At the very least BTC should bounce here as it’s reaching the zones earlier highlighted.
Zooming in there is some small lower high structure that price will test (dotted lines) but it will more than likely… https://t.co/Be3FKYnRIY pic.twitter.com/XmrCDS9ldQ
— Crypto Nova (@CryptoGirlNova) August 26, 2025
The combination of weakening taker ratios and cautious technical outlooks suggests that Bitcoin’s trajectory may be entering a decisive phase. If selling pressure persists, the asset could face deeper corrections, but sustained support near $110,000 may also provide the base for renewed momentum.
Featured image created with DALL-E, Chart from TradingView
Why this matters
This bitcoin story adds another data point to the current market tape and is useful when read alongside nearby source coverage.
Original source
Read on NewsBTCRelated market context

XRP Price Under Pressure: Spot Selling Overwhelms ETF Demand
XRP price is hovering at the $1.50 level, down 8% over the prior 24 hours after failing to hold the $1.60 level. The drop happens...

Mid-Sized Bitcoin Wallets Add 113,950 Bitcoin as Price Rally Nears Test
Wallets holding between 100 and 1,000 BTC have added 113,950 Bitcoin since July 15, lifting their combined holdings 2.22% to 5.24...

Hyperliquid (HYPE) Price Prediction: Can Whale Buying and Binance Listing Drive HYPE to $210?
The technical setup for Hyperliquid price currently places $110, $130, $160, and $180 among the key levels to watch, while some tr...
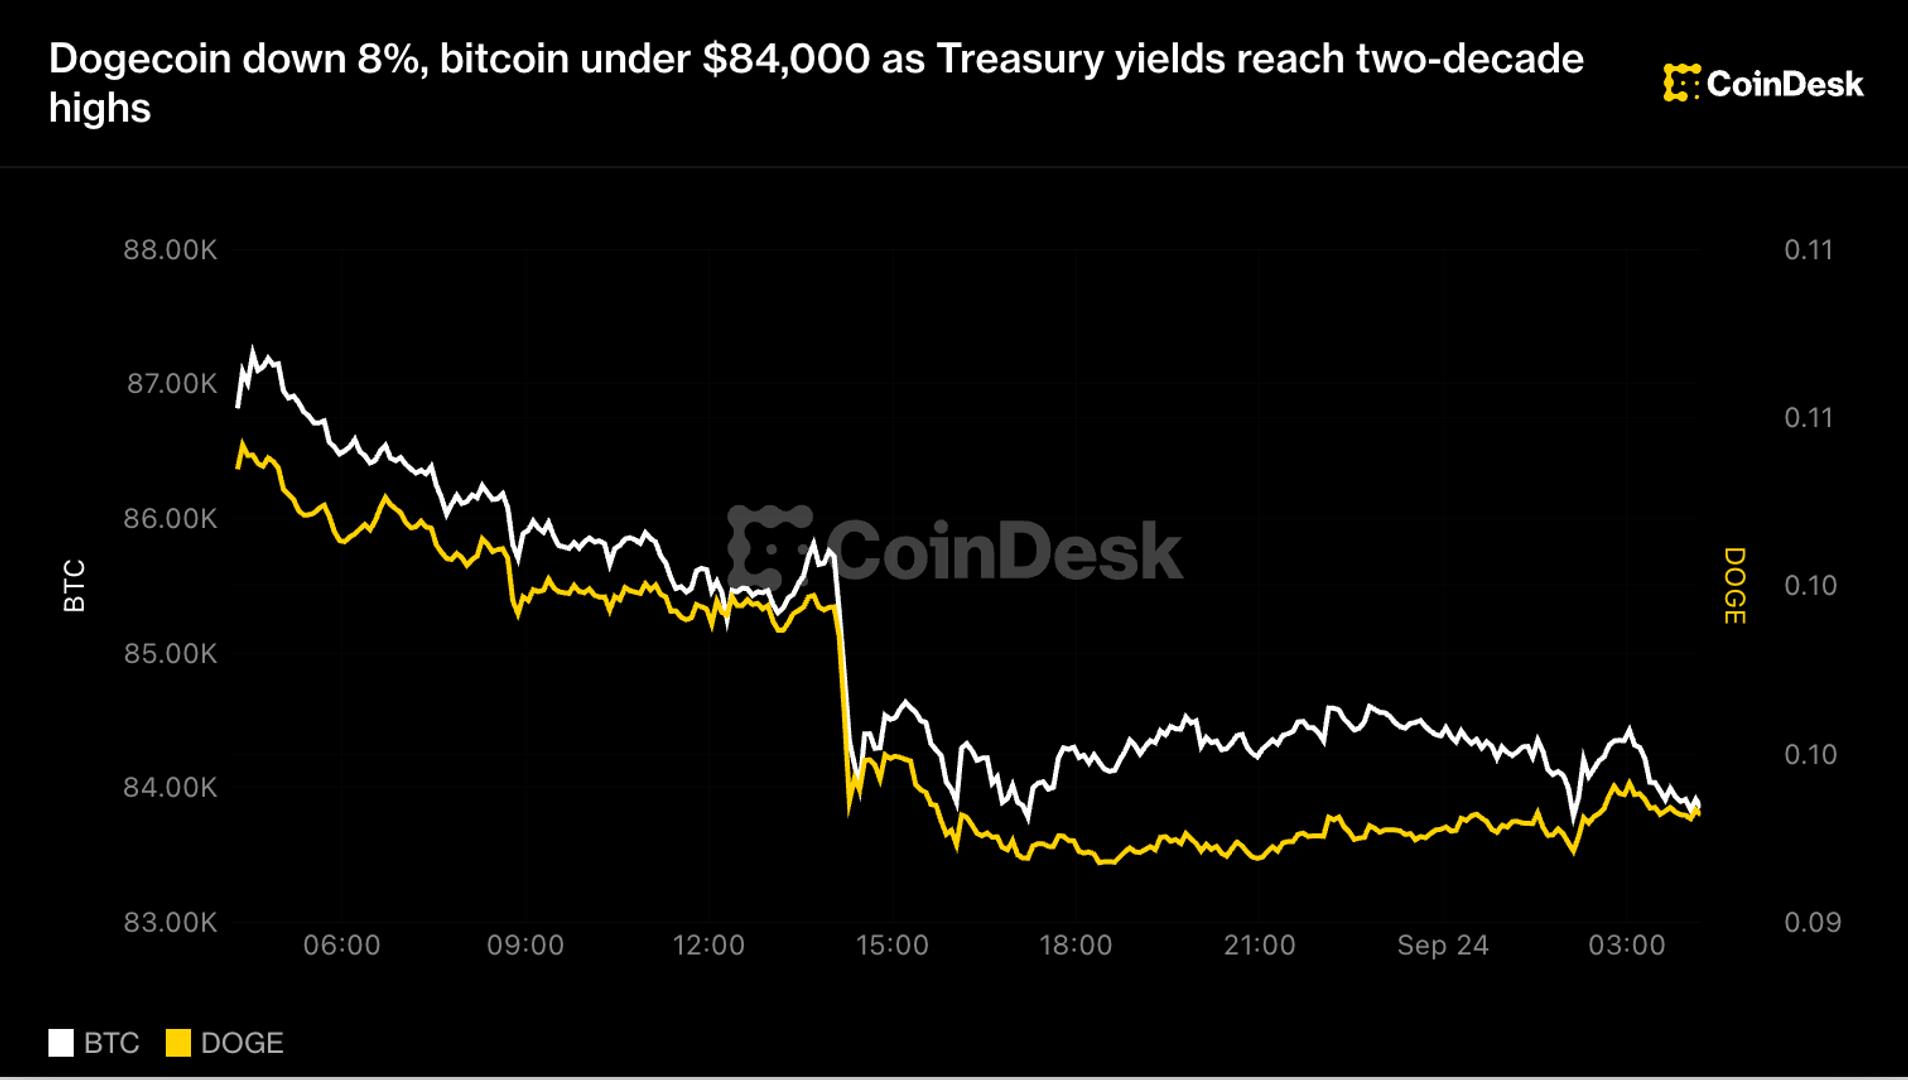
Dogecoin down 8%, bitcoin under $84,000 as Treasury yields hit highest level since 2007
A rebound in oil, the strongest U.S. business survey in five years and a poorly received five-year note sale pushed borrowing cost...

Bitcoin Traders Brace for $15B Options Expiry as Bulls Eye $100,000
Bitcoin Magazine Bitcoin Traders Brace for $15B Options Expiry as Bulls Eye $100,000 Bitcoin bulls are waiting ahead of a huge bat...
Bitcoin’s bear markets are getting milder as institutional capital reshapes the cycle
Institutional investment is stabilizing Bitcoin's market, reducing volatility and shortening bear cycles, signaling maturation in...