Bitcoin Falls Below $113,000, But This Indicator Says It’s Time To Buy
Bitcoin has slipped under the $113,000 level during the past day, but an analyst has pointed out how a technical indicator could suggest this is a buying opportunity. TD Sequential Has Just Given A Buy Signal For Bitcoin...
Archive context
Older archive item. Useful for background and entity history, but not a fresh market-moving signal.

Bitcoin has slipped under the $113,000 level during the past day, but an analyst has pointed out how a technical indicator could suggest this is a buying opportunity.
TD Sequential Has Just Given A Buy Signal For BitcoinIn a new post on X, analyst Ali Martinez has talked about how the Tom Demark (TD) Sequential has just formed a signal for Bitcoin on its 4-hour price chart. The TD Sequential is an indicator from technical analysis (TA) that’s used for locating potential points of reversal in an asset’s price.
The indicator involves two phases. In the first of these, known as the setup, it counts candles of the same color up to nine. Once the ninth candle is in, it gives a turnaround signal for the asset. Naturally, the signal is a buy one if the preceding candles were red and a sell one if they were green.
As soon as the setup is over, the second phase, called the countdown, kicks off. The countdown works much like the setup, with the key difference being that the indicator counts up thirteen candles here, not nine. Following these thirteen candles, the price trend is considered to have reached exhaustion once more. In other words, the asset may have reached another top or bottom.
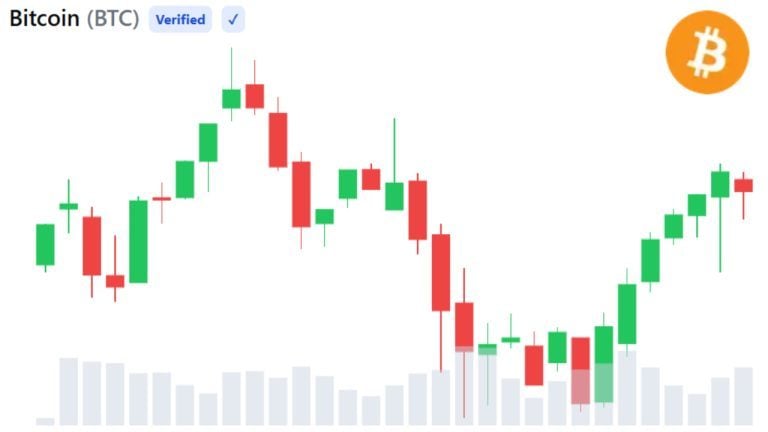
Bitcoin has completed a TD Sequential phase of the first type recently. Below is the chart shared by Martinez that shows the signal forming in BTC’s 4-hour price.
From the graph, it’s visible that the TD Sequential has completed this setup with nine red candles, which implies Bitcoin may have arrived at some sort of bottom.
The signal has come as the cryptocurrency’s price has plummeted and retraced its recent recovery. It now remains to be seen whether the buy setup will hold, or if there is more decline coming for the asset.
In another X post, the analyst has talked about a potential pattern forming for Bitcoin that could also point to a bullish outcome.
As displayed in the above chart, Bitcoin’s 4-hour price has potentially been following an inverse head-and-shoulders. This pattern appears whenever an asset’s price registers a low (called the head) between two higher lows (the shoulders).
BTC has formed the left shoulder and head so far, with the right shoulder possibly brewing with the price crash. In the scenario that the right shoulder does get confirmed, a bullish breakout may follow for the cryptocurrency, since an inverse head-and-shoulders is generally considered to be a bullish reversal pattern.
BTC PriceAt the time of writing, Bitcoin is trading around $112,300, down over 2.5% in the last 24 hours.
Why this matters
This bitcoin story adds another data point to the current market tape and is useful when read alongside nearby source coverage.
Original source
Read on NewsBTCRelated market context

Vanguard is Hiring for Its First Head of Digital Assets, Signaling a Shift From Its Crypto-Skeptic Past
Vanguard, the roughly $10 trillion asset manager that spent years as one of crypto’s most prominent institutional skeptics, has op...

XRP Price Prediction: XRP Faces Critical Resistance Near $1.17 Despite Ripple Securing Landmark EU License
While the company secured a full MiCA license that expands its operations across the European Economic Area, market indicators sug...

Bitcoin Price Prediction: Can Tether’s Brazil Push Boost BTC Despite Europe’s USDT Exit?
Bitcoin price is trading around $62,700 after clawing back from last week’s slide below $60,000, as a bearish prediction remains....
Bitcoin ETFs draw $500M but weak demand leaves rebound exposed
US spot Bitcoin exchange-traded funds drew nearly $500 million across the last two trading sessions, giving traders their first cl...

XRP Ledger tokenized assets soar to $4B, challenging Ethereum, BNB Chain
XRP Ledger's asset growth may reshape the tokenization landscape, challenging Ethereum's dominance and signaling increased institu...
Whale Buying Hints at Bitcoin Bottom After Worst Month Since 2022 — 3 Signals to Watch
Three signals may determine whether bitcoin’s worst month since 2022 marks a bottom, as tighter central bank policy, inflation pre...