Bitcoin in Decline: Price Turns Red as Market Eyes Fed Decision
Bitcoin price extended losses below $67,500 support zone. BTC tested the $66,000 support zone and is now attempting a recovery wave. Bitcoin started another decline below the $68,500 support zone. The price is trading be...
Archive context
Older archive item. Useful for background and entity history, but not a fresh market-moving signal.

Bitcoin price extended losses below $67,500 support zone. BTC tested the $66,000 support zone and is now attempting a recovery wave.
- Bitcoin started another decline below the $68,500 support zone.
- The price is trading below $68,000 and the 100 hourly Simple moving average.
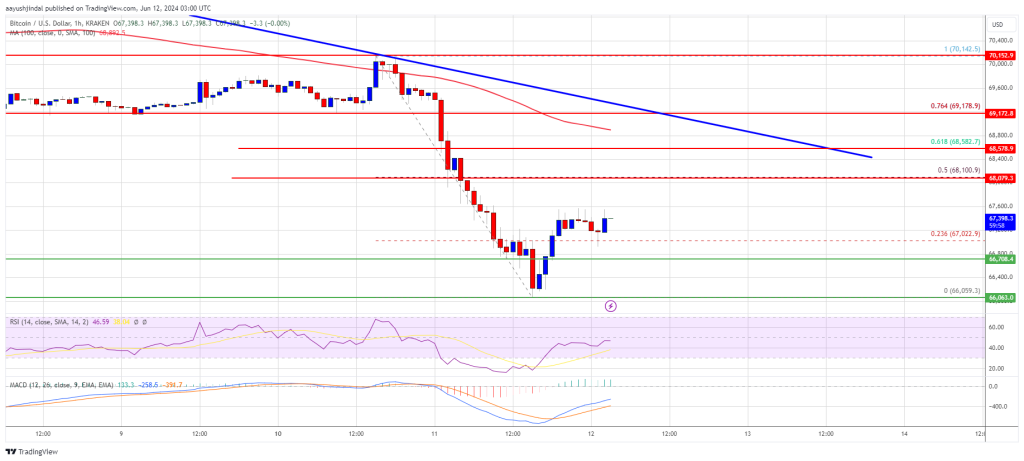
- There is a connecting bearish trend line forming with resistance at $68,650 on the hourly chart of the BTC/USD pair (data feed from Kraken).
- The pair could recover but the upsides might be limited above the $68,500 level.
Bitcoin price failed to start another increase above the $68,500 resistance zone. BTC reacted to the downside and traded below the $68,000 level. There was a drop below the $67,500 and $67,000 levels.
The price tested the $66,000 zone. A low was formed at $66,059 and the price is now consolidating losses above the 23.6% Fib retracement level of the downward move from the $70,143 swing high to the $66,059 low. Bitcoin is now trading below $68,500 and the 100 hourly Simple moving average.
On the upside, the price is facing resistance near the $67,600 level. The first major resistance could be $68,000 and the 50% Fib retracement level of the downward move from the $70,143 swing high to the $66,059 low.
The next key resistance could be $68,500. There is also a connecting bearish trend line forming with resistance at $68,650 on the hourly chart of the BTC/USD pair. The trend line is also close to the 100 hourly Simple moving average.
A clear move above the $68,500 resistance might send the price higher. In the stated case, the price could rise and test the $69,000 resistance. Any more gains might send BTC toward the $70,200 resistance in the near term.
More Losses In BTC?If Bitcoin fails to climb above the $68,500 resistance zone, it could start another decline. Immediate support on the downside is near the $66,700 level.
The first major support is $66,200. The next support is now forming near $66,000. Any more losses might send the price toward the $65,500 support zone in the near term.
Technical indicators:
Hourly MACD – The MACD is now losing pace in the bearish zone.
Hourly RSI (Relative Strength Index) – The RSI for BTC/USD is now below the 50 level.
Major Support Levels – $66,700, followed by $66,000.
Major Resistance Levels – $68,000, and $68,500.
Why this matters
This bitcoin story adds another data point to the current market tape and is useful when read alongside nearby source coverage.
Original source
Read on NewsBTCRelated market context

XRP Price Prediction: XRP Faces Critical Resistance Near $1.17 Despite Ripple Securing Landmark EU License
While the company secured a full MiCA license that expands its operations across the European Economic Area, market indicators sug...

Bitcoin (BTC) Price Prediction: BTC Holds $63K Support—Can Rising Active Addresses Offset Bearish Technical Signals?
Although the BTC price has remained near a key support zone, recent chart signals and Strategy’s sale of a portion of its Bitcoin...

Bitcoin price rebounds to $63K as leverage returns creating short term volatility risk
Bitcoin's rebound has cleared the first test: price recovered. The harder one starts now: proving buyers remain after the squeeze....
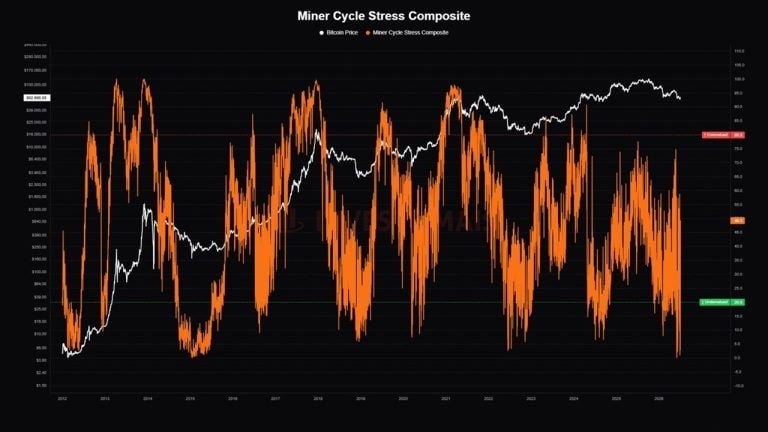
Bitcoin Miner Stress Hits ‘Historically Rare’ Level as 20% of Miners Operate at a Loss
Bitcoin’s Miner Cycle Stress Composite has fallen to a new 2026 low and entered its “undervalued” range, a synchronized decline pr...

New SummerFi DeFi exploit shows AI automation now sits above smart contract risk
Summer.fi's automated vault incident has put delegated DeFi yield back under pressure after Blockaid said on July 6 that its explo...

Strategy dumps 3,500 BTC in largest sale… yet
Michael Saylor’s Strategy (formerly MicroStrategy) has sold 3,588 BTC for $216 million. His average sale price was approximately $...