Bitcoin Price 10% Selloff Sparks Fears Of A Deeper Breakdown
Bitcoin price started a fresh decline below the $68,000 zone. BTC is down over 10% and might continue to move down if it dips below $62,000. Bitcoin failed to stay above $68,500 and extended losses. The price is trading...
Archive context
Older archive item. Useful for background and entity history, but not a fresh market-moving signal.

Bitcoin price started a fresh decline below the $68,000 zone. BTC is down over 10% and might continue to move down if it dips below $62,000.
- Bitcoin failed to stay above $68,500 and extended losses.
- The price is trading below $65,000 and the 100 hourly simple moving average.
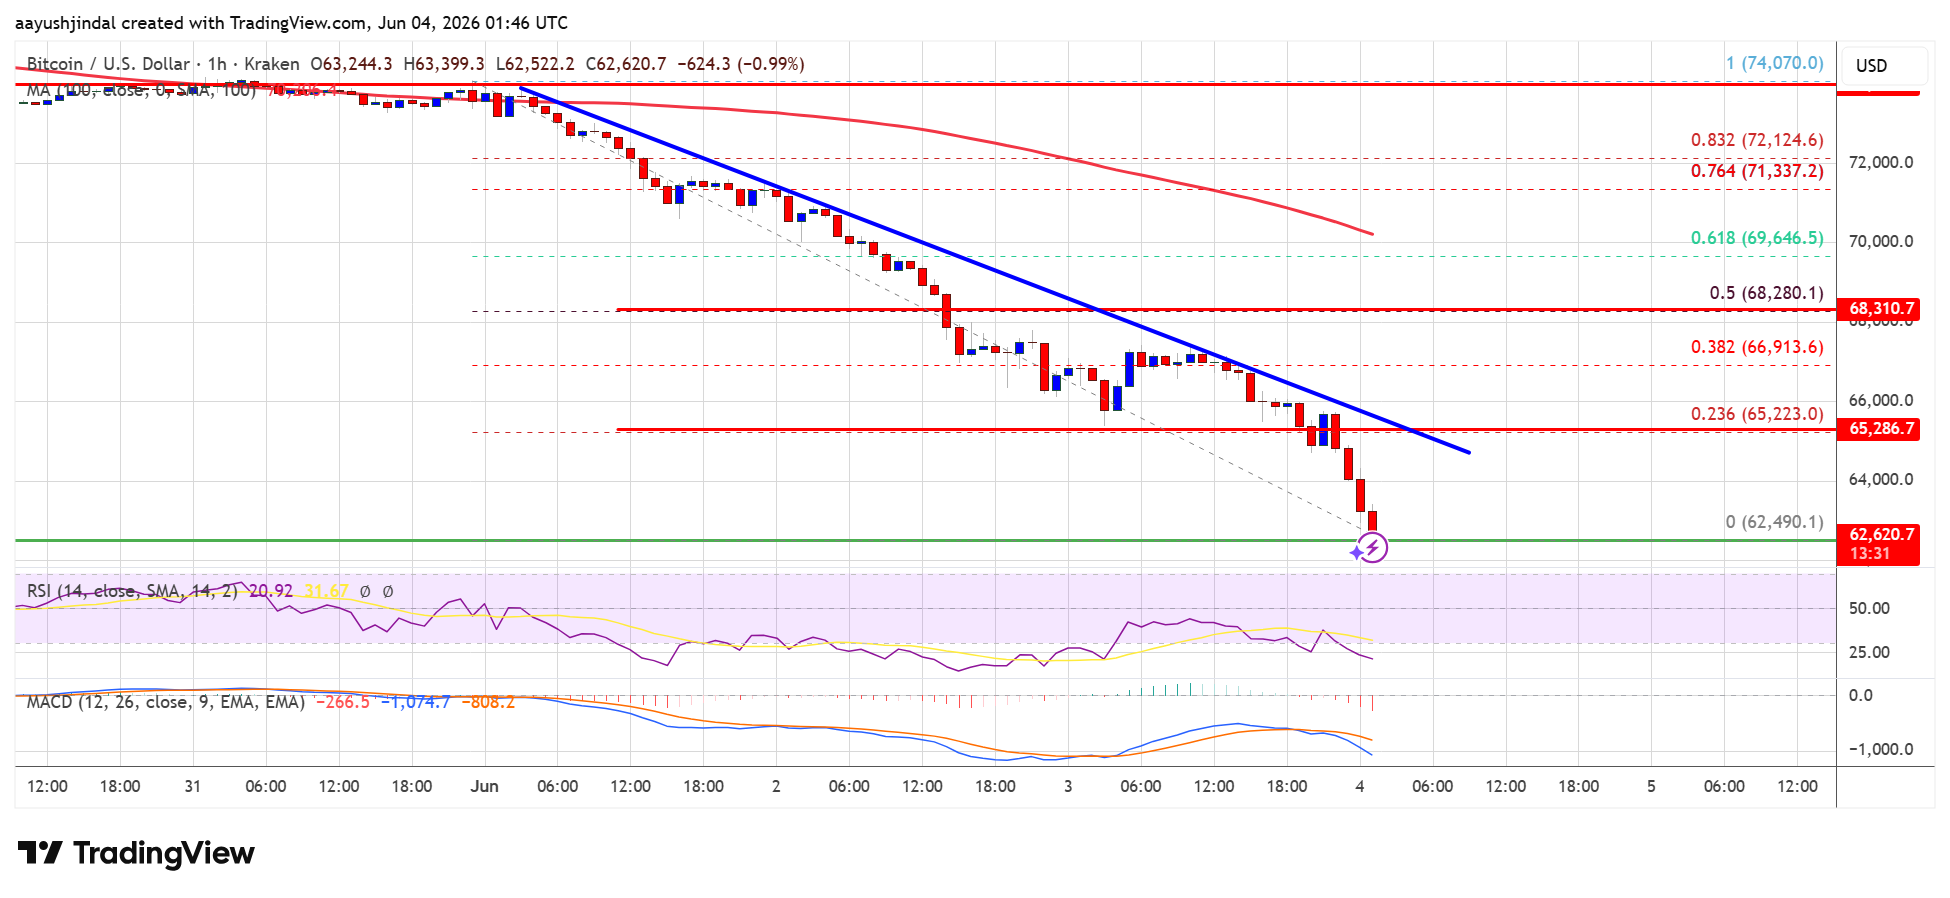
- There is a bearish trend line forming with resistance near $65,200 on the hourly chart of the BTC/USD pair (data feed from Kraken).
- The pair might extend losses if it stays below the $65,000 and $66,500 levels.
Bitcoin price failed to stay above the $70,000 support zone. BTC remained in a bearish zone and extended losses below the $68,000 level. There was a move below the $65,000 level.
The price even dipped below $63,200. A low was formed at $62,490 and the price is now showing many bearish signs. It is well below the 23.6% Fib retracement level of the downward move from the $74,070 swing high to the $62,490 low.
Bitcoin is now trading below $65,000 and the 100 hourly simple moving average. If the price remains stable above $62,000, it could attempt a fresh increase. Immediate resistance is near the $63,500 level.
The first key resistance is near the $64,000 level. A close above the $64,000 resistance might send the price further higher. In the stated case, the price could rise and test the $65,000 resistance. There is also a bearish trend line forming with resistance near $65,200 on the hourly chart of the BTC/USD pair.
Any more gains might send the price toward the $66,500 level. The next barrier for the bulls could be $68,000 or the 50% Fib retracement level of the downward move from the $74,070 swing high to the $62,490 low.
More Losses In BTC?If Bitcoin fails to rise above the $65,000 resistance zone, it could start another decline. Immediate support is near the $62,500 level.
The first major support is near the $62,000 level. The next support is now near the $61,200 zone. Any more losses might send the price toward the $60,500 support in the near term. The main support now sits at $60,000, below which BTC might struggle to recover in the near term.
Technical indicators:
Hourly MACD – The MACD is now gaining pace in the bearish zone.
Hourly RSI (Relative Strength Index) – The RSI for BTC/USD is now below the 50 level.
Major Support Levels – $62,000, followed by $60,000.
Major Resistance Levels – $64,000 and $65,000.
Why this matters
Bitcoin is a tracked market entity in the DigitalMoneyBox archive, making this useful context for readers monitoring repeated mentions and follow-up coverage.
Original source
Read on NewsBTCRelated market context

Bitcoin (BTC) Price Today: Michael Saylor’s Strategy Reports $8.3B Loss as BTC Slides Below $64K
The BTC move comes shortly after Strategy reported an $8.33 billion operating loss for the second quarter of 2026, including an $8...

If Bitcoin breaks $62k over the weekend, a $1.1B short overhang stands ready to pull price down to $60k
Bitcoin enters the weekend near $62,900, less than 1% above the July 31 intraday low, and Deribit has already settled roughly $9.6...

Coldcard’s $89M wallet bug triggers the biggest Bitcoin movement since FTX and completely distorts market signals
Coldcard’s wallet crisis has shaken Bitcoin sentiment, blurred on-chain signals and exposed a recurring weakness in AI-assisted cy...

Bitcoin (BTC) Price Prediction: TD Sequential Sell Signal and Weak August History Raise Pullback Risks
The latest market snapshots show Bitcoin trading near $63,000–$64,000, with traders watching whether support around $62,800 can ho...

Sam Altman ChatGPT AI Predicts a Historic XRP Price Move Before End of 2026
ChatGPT AI predicts a multi-year breakout for XRP, with the price prediction extending all the way to the end of 2027. From today’...

Bitcoin Price Prediction: Michael Saylor’s Strategy Posts Massive Q2 Loss Despite Bigger Bitcoin Stack
Bitcoin is trading around $63,000 to $65,000 price range, as Strategy’s weak Q2 earnings add pressure to an already cautious marke...