Bitcoin Price At Risk of Another Downside Thrust Before Higher
Bitcoin price is struggling to settle above the $68,000 resistance. BTC is now consolidating and might decline toward the $63,400 support zone. Bitcoin price is struggling to gain pace for more gains above the new all-ti...
Archive context
Older archive item. Useful for background and entity history, but not a fresh market-moving signal.
Bitcoin price is struggling to settle above the $68,000 resistance. BTC is now consolidating and might decline toward the $63,400 support zone.
- Bitcoin price is struggling to gain pace for more gains above the new all-time.
- The price is trading above $65,000 and the 100 hourly Simple moving average.
- There is a short-term bearish trend line forming with resistance near $67,000 on the hourly chart of the BTC/USD pair (data feed from Kraken).
- The pair could extend losses and revisit the $63,400 support zone.
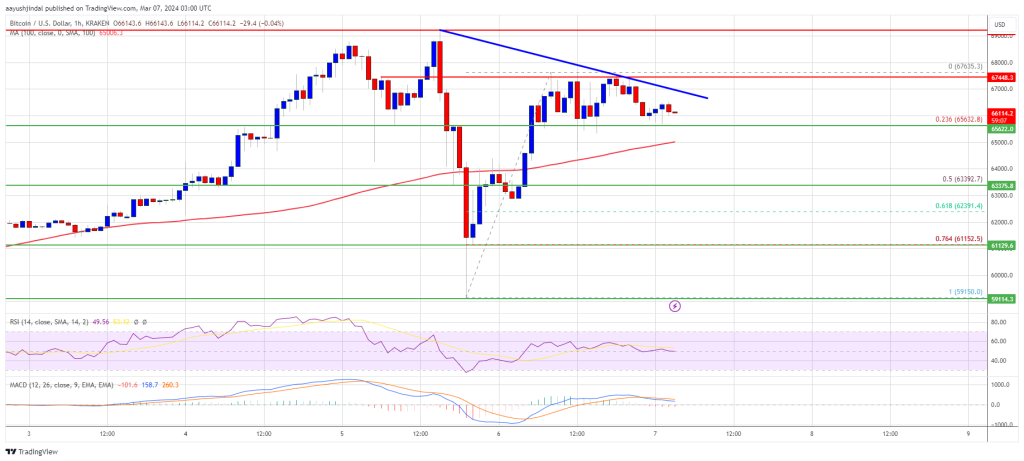
Bitcoin price started a nasty decline from the new all-time high of $69,218. BTC crashed to $59,150 before it trimmed losses. It climbed back above $65,000, but the bears are now protecting more upsides above the $67,500 level.
A high was formed at $67,635 and the price is now consolidating. It is trading above the 23.6% Fib retracement level of the upward move from the $59,150 swing low to the $67,635 high.
Bitcoin is still trading above $65,000 and the 100 hourly Simple moving average. Immediate resistance is near the $67,000 level. There is also a short-term bearish trend line forming with resistance near $67,000 on the hourly chart of the BTC/USD pair.
Source: BTCUSD on TradingView.com
The next key resistance could be $68,000, above which the price could rise toward the $69,200 resistance zone. If there is a clear move above the $69,200 resistance zone, the price could rise toward the $70,000 level. Any more gains might send the price toward the $72,000 level.
Another Decline In BTC?If Bitcoin fails to rise above the $67,000 resistance zone, it could start another downside correction. Immediate support on the downside is near the $66,650 level.
The first major support is $65,000. If there is a close below $65,000, the price could start a decent pullback toward the 50% Fib retracement level of the upward move from the $59,150 swing low to the $67,635 high at $63,400. Any more losses might send the price toward the $62,500 support zone.
Technical indicators:
Hourly MACD – The MACD is now gaining pace in the bearish zone.
Hourly RSI (Relative Strength Index) – The RSI for BTC/USD is now near the 50 level.
Major Support Levels – $65,000, followed by $63,400.
Major Resistance Levels – $67,000, $68,000, and $69,200.
Why this matters
This bitcoin story adds another data point to the current market tape and is useful when read alongside nearby source coverage.
Original source
Read on NewsBTCRelated market context

Bitcoin Slips to $62,000, Paring Rebound as CryptoQuant Sees Room Higher
Bitcoin Magazine Bitcoin Slips to $62,000, Paring Rebound as CryptoQuant Sees Room Higher Bitcoin traded near $62,000 today, surre...

Cardano Price Prediction: ADA Pulls Back to $0.17 After a Strong Weekly Rally as Bulls Watch $0.20 and $0.22 Reclaim
Cardano price is trading near $0.17 after a weaker 24-hour session, according to Brave New Coin data. ADA is down around 4.84% on...

Bitcoin’s ETF comeback is relying on a $79B futures market betting the rebound holds
Bitcoin’s rebound above $63,000 is being helped by renewed ETF inflows, but the harder test will now be whether the liquidity bene...

Hedge Funds Are Most Bearish onYen Since 2007: Could Japan Rotation Send XRP to $2.00?
XRP News: XRP is trading around $1.07, down roughly 3% over the past 24 hours, but still carrying a 6–7% weekly gain that keeps th...

XRP Reclaims A Key Support Zone As Traders Watch Open Interest Build
XRP has moved back into a zone traders are watching closely, with the $0.50 area acting as the line that decides whether the lates...

XRP cleaned out leverage, now ETF demand has to prove itself
XRP’s late-June washout removed a major source of market instability: excess leverage that could have turned another sharp move in...