Bitcoin Price at Risk of Further Downside: Will Bears Tighten Grip?
Bitcoin price started another decline from the $60,650 resistance. BTC is now at risk of more downsides below the $57,500 support zone. Bitcoin is correcting gains and gaining bearish pace below the $59,000 level. The pr...
Archive context
Older archive item. Useful for background and entity history, but not a fresh market-moving signal.

Bitcoin price started another decline from the $60,650 resistance. BTC is now at risk of more downsides below the $57,500 support zone.
- Bitcoin is correcting gains and gaining bearish pace below the $59,000 level.
- The price is trading below $58,500 and the 100 hourly Simple moving average.
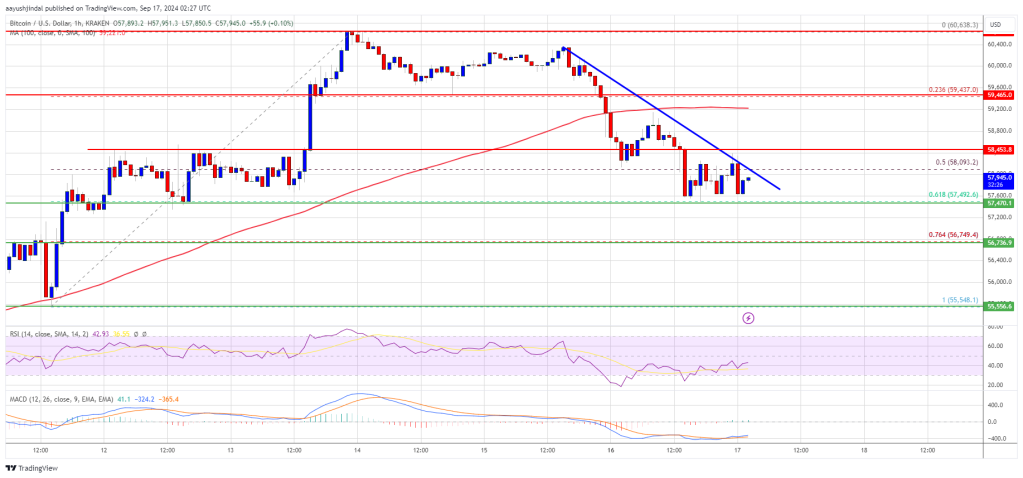
- There is a connecting bearish trend line forming with resistance at $58,000 on the hourly chart of the BTC/USD pair (data feed from Kraken).
- The pair could climb again if it stays above the $57,500 support zone.
Bitcoin price struggled to clear the $60,000 resistance zone and started a fresh decline. BTC declined below the $60,000 and $59,500 levels to start a downside correction.
There was a drop below the 50% Fib retracement level of the upward move from the $55,550 swing low to the $60,638 high. The bears were able to push the price toward the $57,500 support zone. There is now a connecting bearish trend line forming with resistance at $58,000 on the hourly chart of the BTC/USD pair.
Bitcoin is now trading below $58,500 and the 100 hourly Simple moving average. It is testing the 61.8% Fib retracement level of the upward move from the $55,550 swing low to the $60,638 high.
On the upside, the price could face resistance near the $58,000 level and the trend line. The first key resistance is near the $59,200 level and the 100 hourly Simple moving average. A clear move above the $59,200 resistance might start a steady increase in the coming sessions.
The next key resistance could be $60,000. A close above the $60,000 resistance might spark more upsides. In the stated case, the price could rise and test the $60,650 resistance.
More Downsides In BTC?If Bitcoin fails to rise above the $58,000 resistance zone, it could continue to move down. Immediate support on the downside is near the $57,500 level.
The first major support is $56,750. The next support is now near the $56,250 zone. Any more losses might send the price toward the $55,550 support in the near term.
Technical indicators:
Hourly MACD – The MACD is now gaining pace in the bearish zone.
Hourly RSI (Relative Strength Index) – The RSI for BTC/USD is now below the 50 level.
Major Support Levels – $57,500, followed by $56,750.
Major Resistance Levels – $58,000, and $59,200.
Why this matters
This bitcoin story adds another data point to the current market tape and is useful when read alongside nearby source coverage.
Original source
Read on NewsBTCRelated market context

Solana Price Prediction: SOL Holds Near $81 as Breakout Setup Points to $87, but Whale Flows Keep Risk Active
Solana price is back in focus after a sharp recovery pushed SOL towards the $81 area. The move has improved short-term momentum, e...

Hyperliquid (HYPE) Price Prediction: Symmetrical Triangle Breakout Puts $77 Target Back in Focus
The breakout comes after several sessions of price compression, with HYPE continuing to trade within a broader technical structure...

Bitcoin Price Prediction: Saylor’s Strategy is a Risk to Bitcoin, According to JP Morgan
JPMorgan has flagged a structural risk most Bitcoin price prediction bulls haven’t priced in: the same entity driving the most agg...

Bitcoin whales send 49,000 BTC to exchanges as $60K rebound shows signs of weakness
Bitcoin’s recovery above $60,000 is facing a fresh test from exchange-flow and derivatives data after large holders moved one of t...

Bitcoin Price Eyes Recovery After END-OF-CYCLE STRC Shock, Bitwise CIO Says Strategy Will Be ‘Less Important’ Next BTC Cycle
While improving macroeconomic conditions have supported a modest Bitcoin price rebound, Bitwise Chief Investment Officer Matt Houg...

Bitcoin Rebounds Toward $63,000, But ETF Flows Still Hold The Key
Bitcoin has started the new week with a little more colour on the screen. After sliding through the kind of levels that usually tr...